Fig. 7
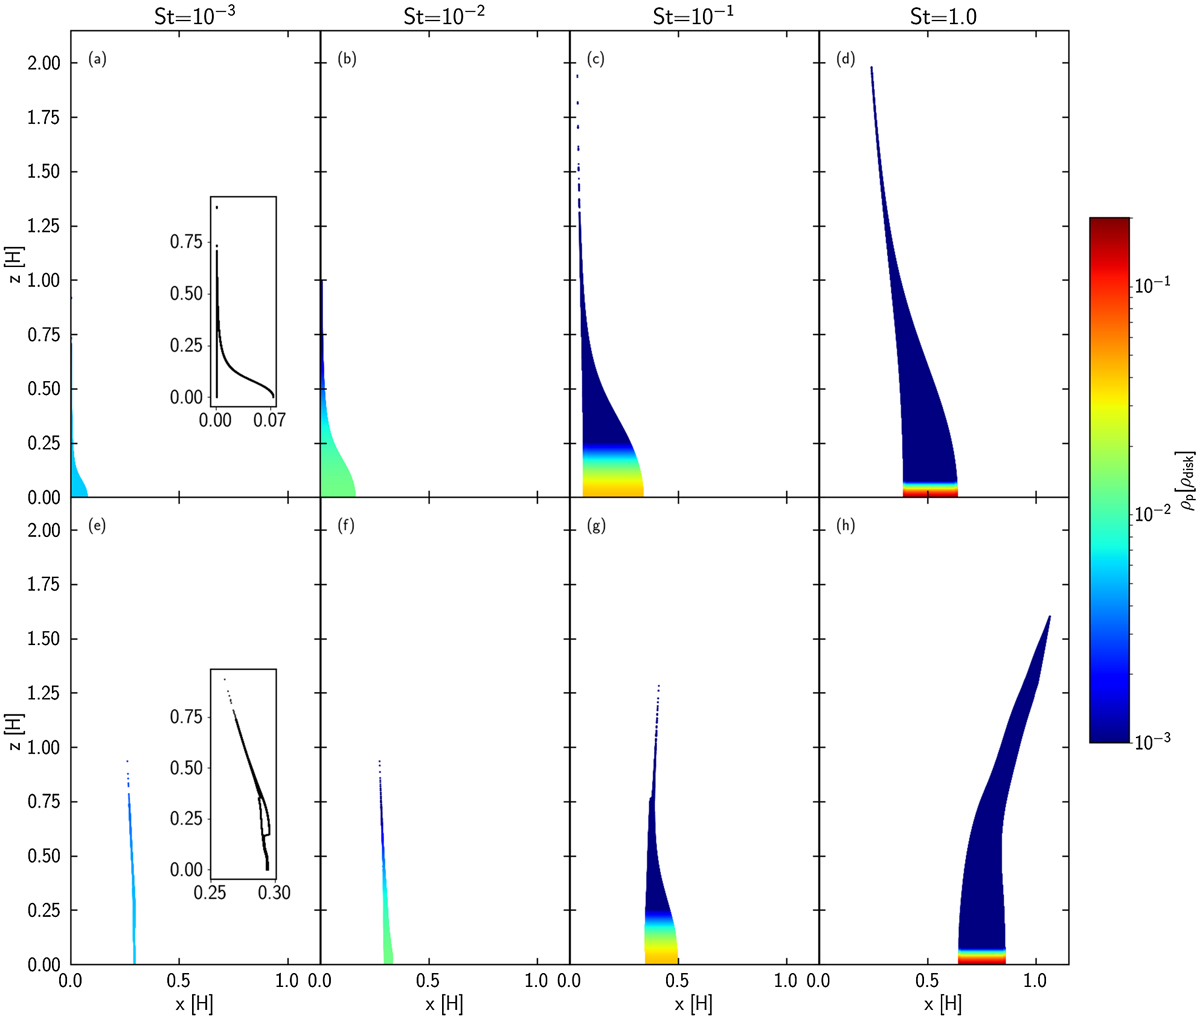
Accretion cross section with the different Stokes numbers for the planet with m = 0.1 in the Shear case (top) and the PI-Stokes case (bottom). We assumed α = 10−3 and the dust-to-gas ratio is equal to 10−2. Color represents the density of the pebbles expressed by Eq. (21) normalized by the gas density. The two panels in panels a and e show the enlarged outlines of accretion cross sections. We note that the color contour is saturated for the ρp ≲ 10−3.
Current usage metrics show cumulative count of Article Views (full-text article views including HTML views, PDF and ePub downloads, according to the available data) and Abstracts Views on Vision4Press platform.
Data correspond to usage on the plateform after 2015. The current usage metrics is available 48-96 hours after online publication and is updated daily on week days.
Initial download of the metrics may take a while.