Free Access
Fig. 3.
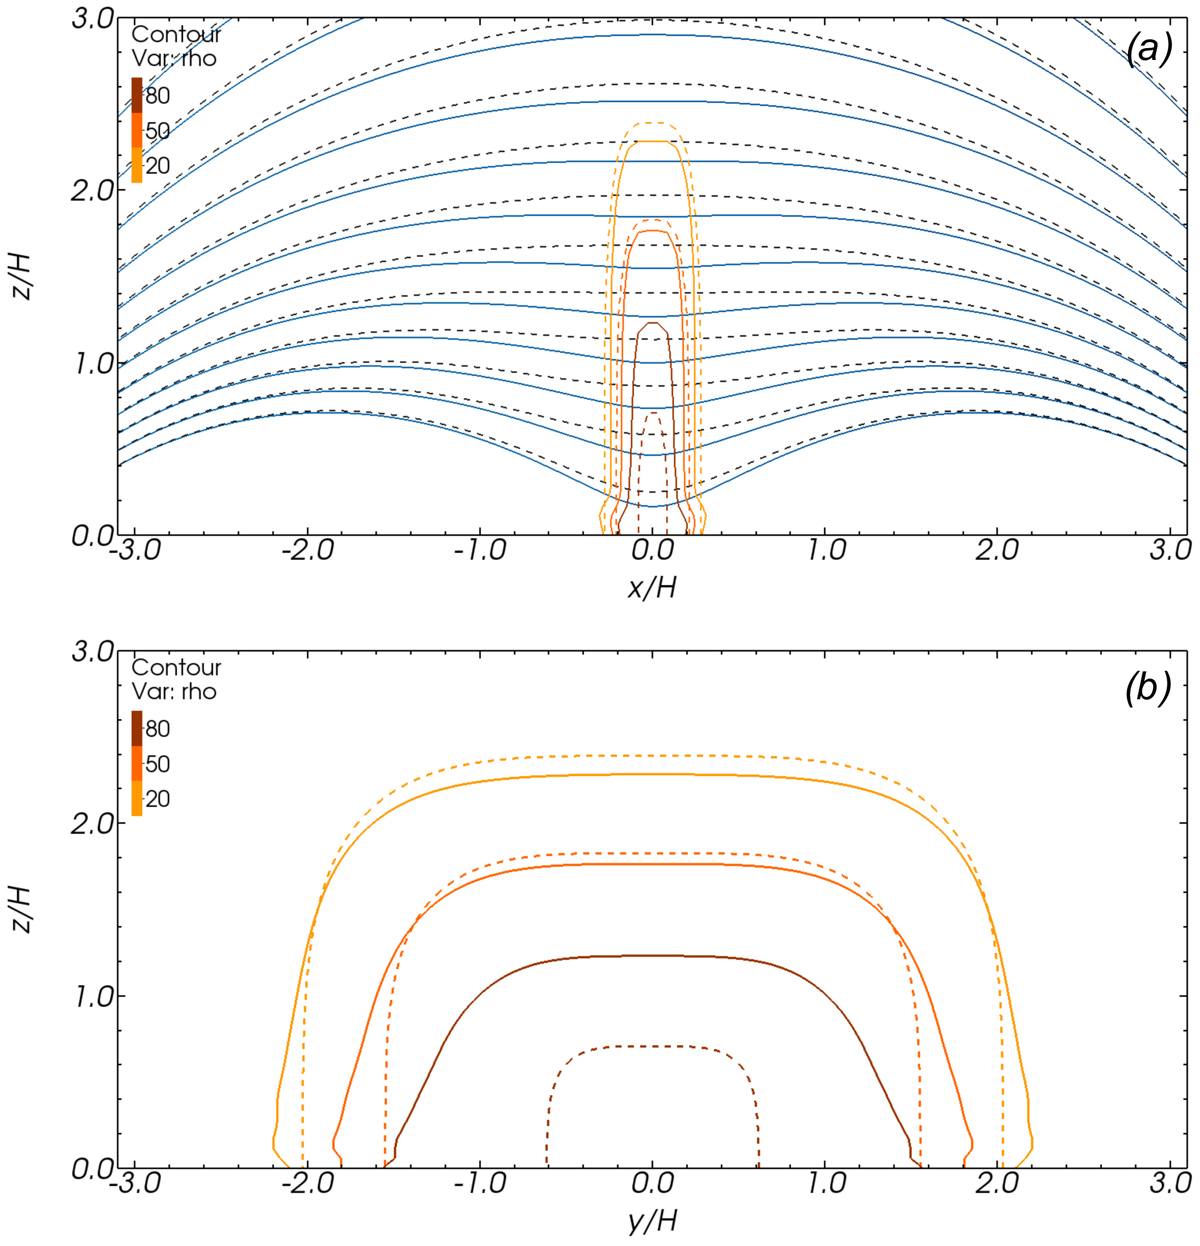
Density distribution of the final equilibrium state at t = 90 min. Top panel: density isocontours and magnetic field lines in the plane y = 0. Bottom panel: density isocontours in the plane x = 0. Dashed lines correspond to the initial reference set-up, and solid lines show the final equilibrium state at t = 90 min.
Current usage metrics show cumulative count of Article Views (full-text article views including HTML views, PDF and ePub downloads, according to the available data) and Abstracts Views on Vision4Press platform.
Data correspond to usage on the plateform after 2015. The current usage metrics is available 48-96 hours after online publication and is updated daily on week days.
Initial download of the metrics may take a while.