Fig. 15.
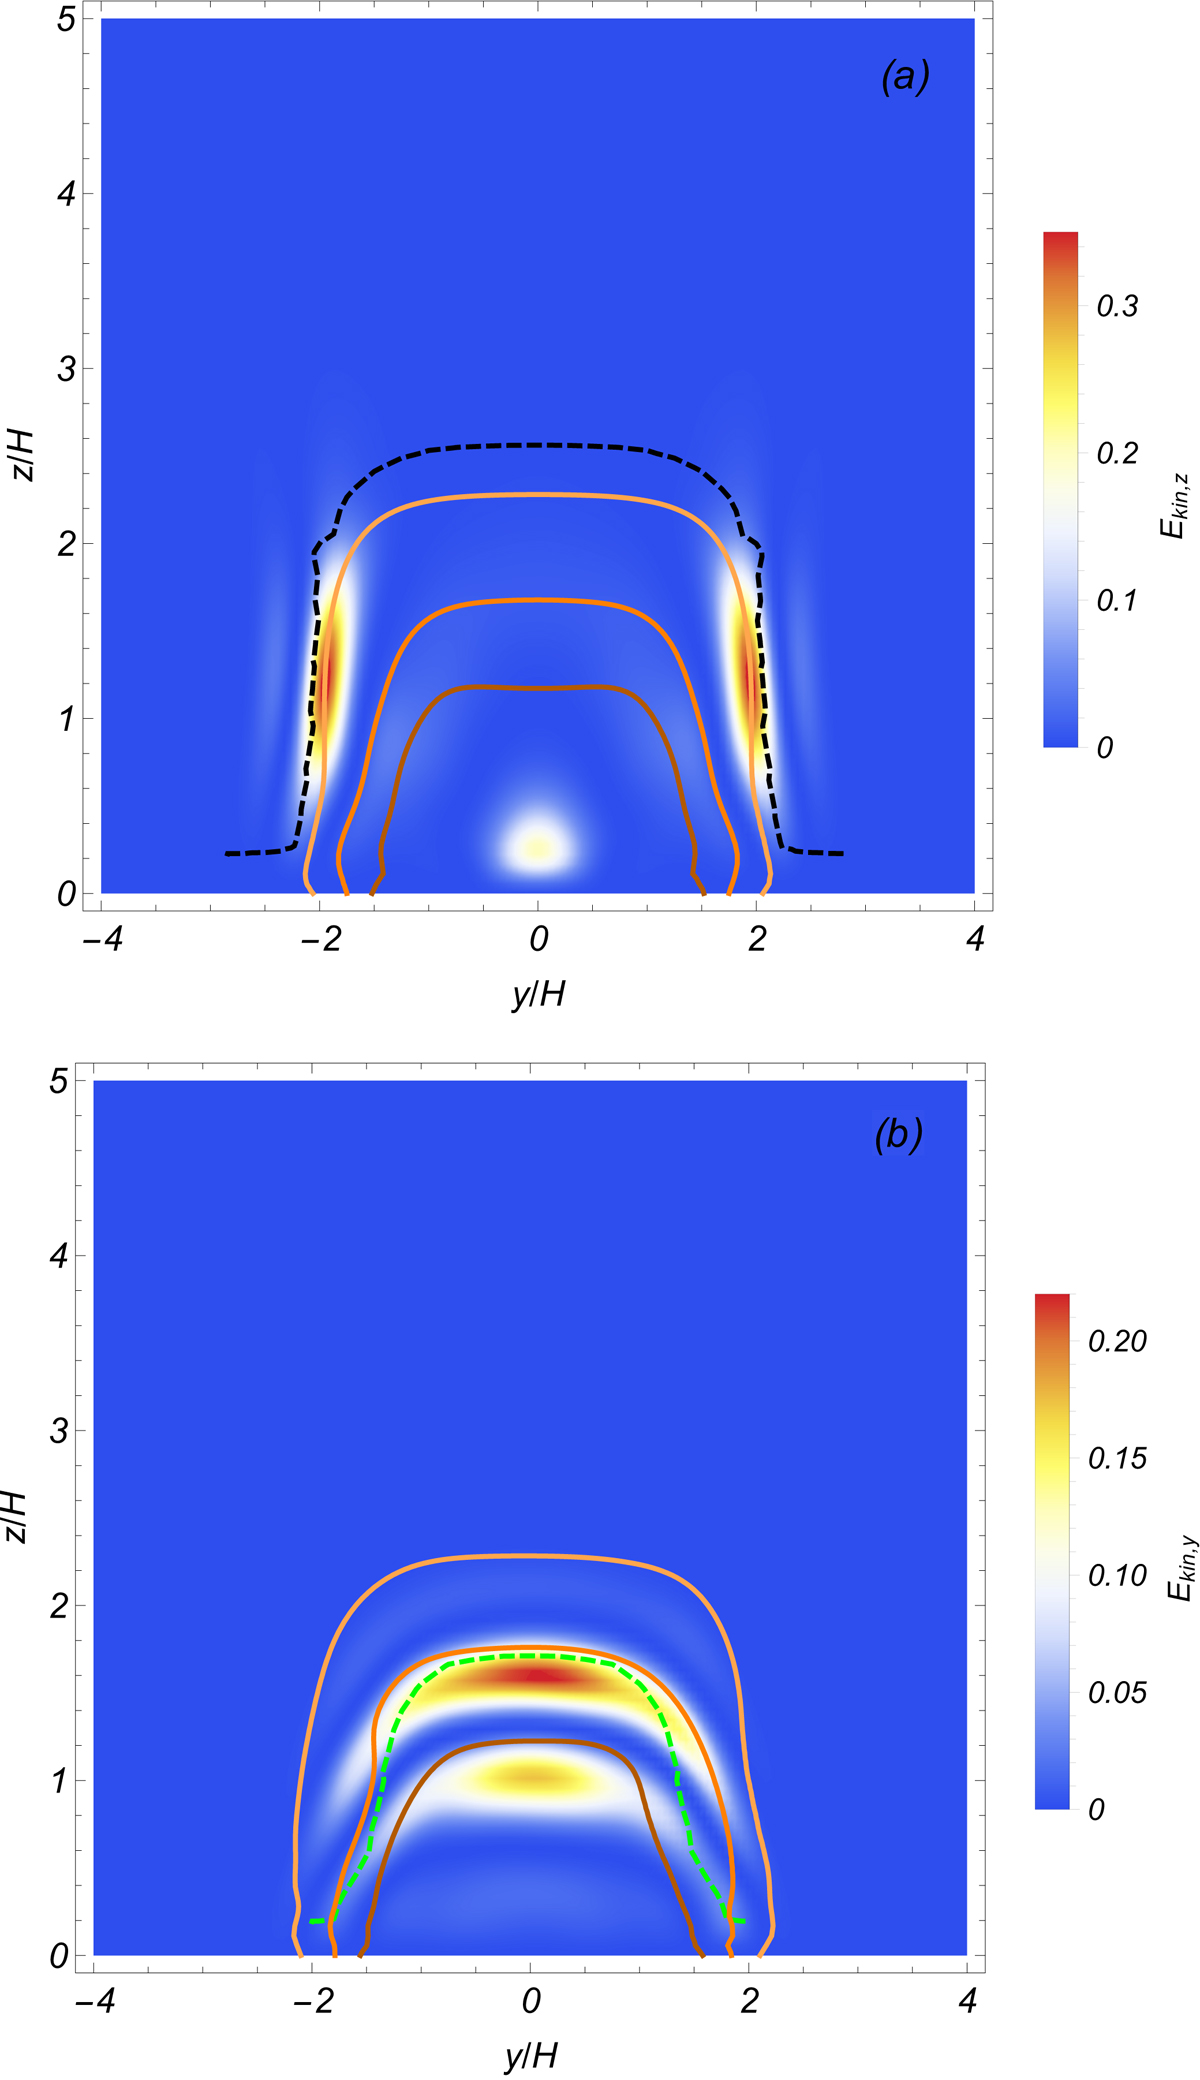
Top panel: snapshot of the vertical kinetic energy and the density profile at t = 8.4 min with the vertical resonant surface (dashed black curve) obtained in Fig. 14. The orange density contours are the same as those in the bottom panel of Fig. 4. Bottom panel: snapshot of the y-component of the kinetic energy and the density profile at t = 32 min with the horizontal resonant surface (dashed green curve) obtained in Fig. 14. The orange density contours are the same as those in the bottom panel of Fig. 11.
Current usage metrics show cumulative count of Article Views (full-text article views including HTML views, PDF and ePub downloads, according to the available data) and Abstracts Views on Vision4Press platform.
Data correspond to usage on the plateform after 2015. The current usage metrics is available 48-96 hours after online publication and is updated daily on week days.
Initial download of the metrics may take a while.