Free Access
Fig. 14.
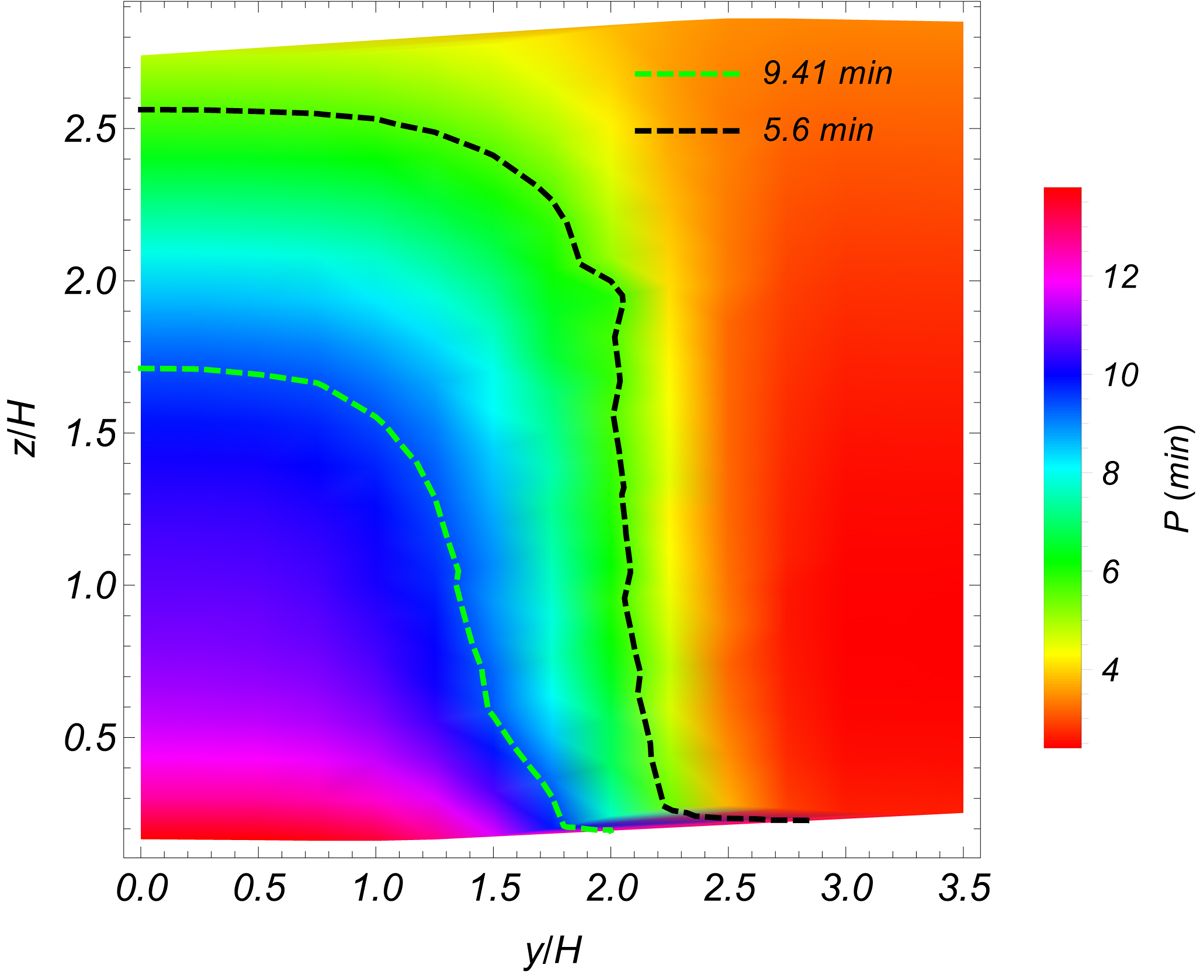
Alfvén continuum spectrum in terms of the periodicity as a function of the position of each field lines at x = 0. Dashed black and green curves are the isocontours corresponding to the periods of the vertical and transverse oscillations, respectively, inferred from the time-dependent simulations.
Current usage metrics show cumulative count of Article Views (full-text article views including HTML views, PDF and ePub downloads, according to the available data) and Abstracts Views on Vision4Press platform.
Data correspond to usage on the plateform after 2015. The current usage metrics is available 48-96 hours after online publication and is updated daily on week days.
Initial download of the metrics may take a while.