Fig. 10.
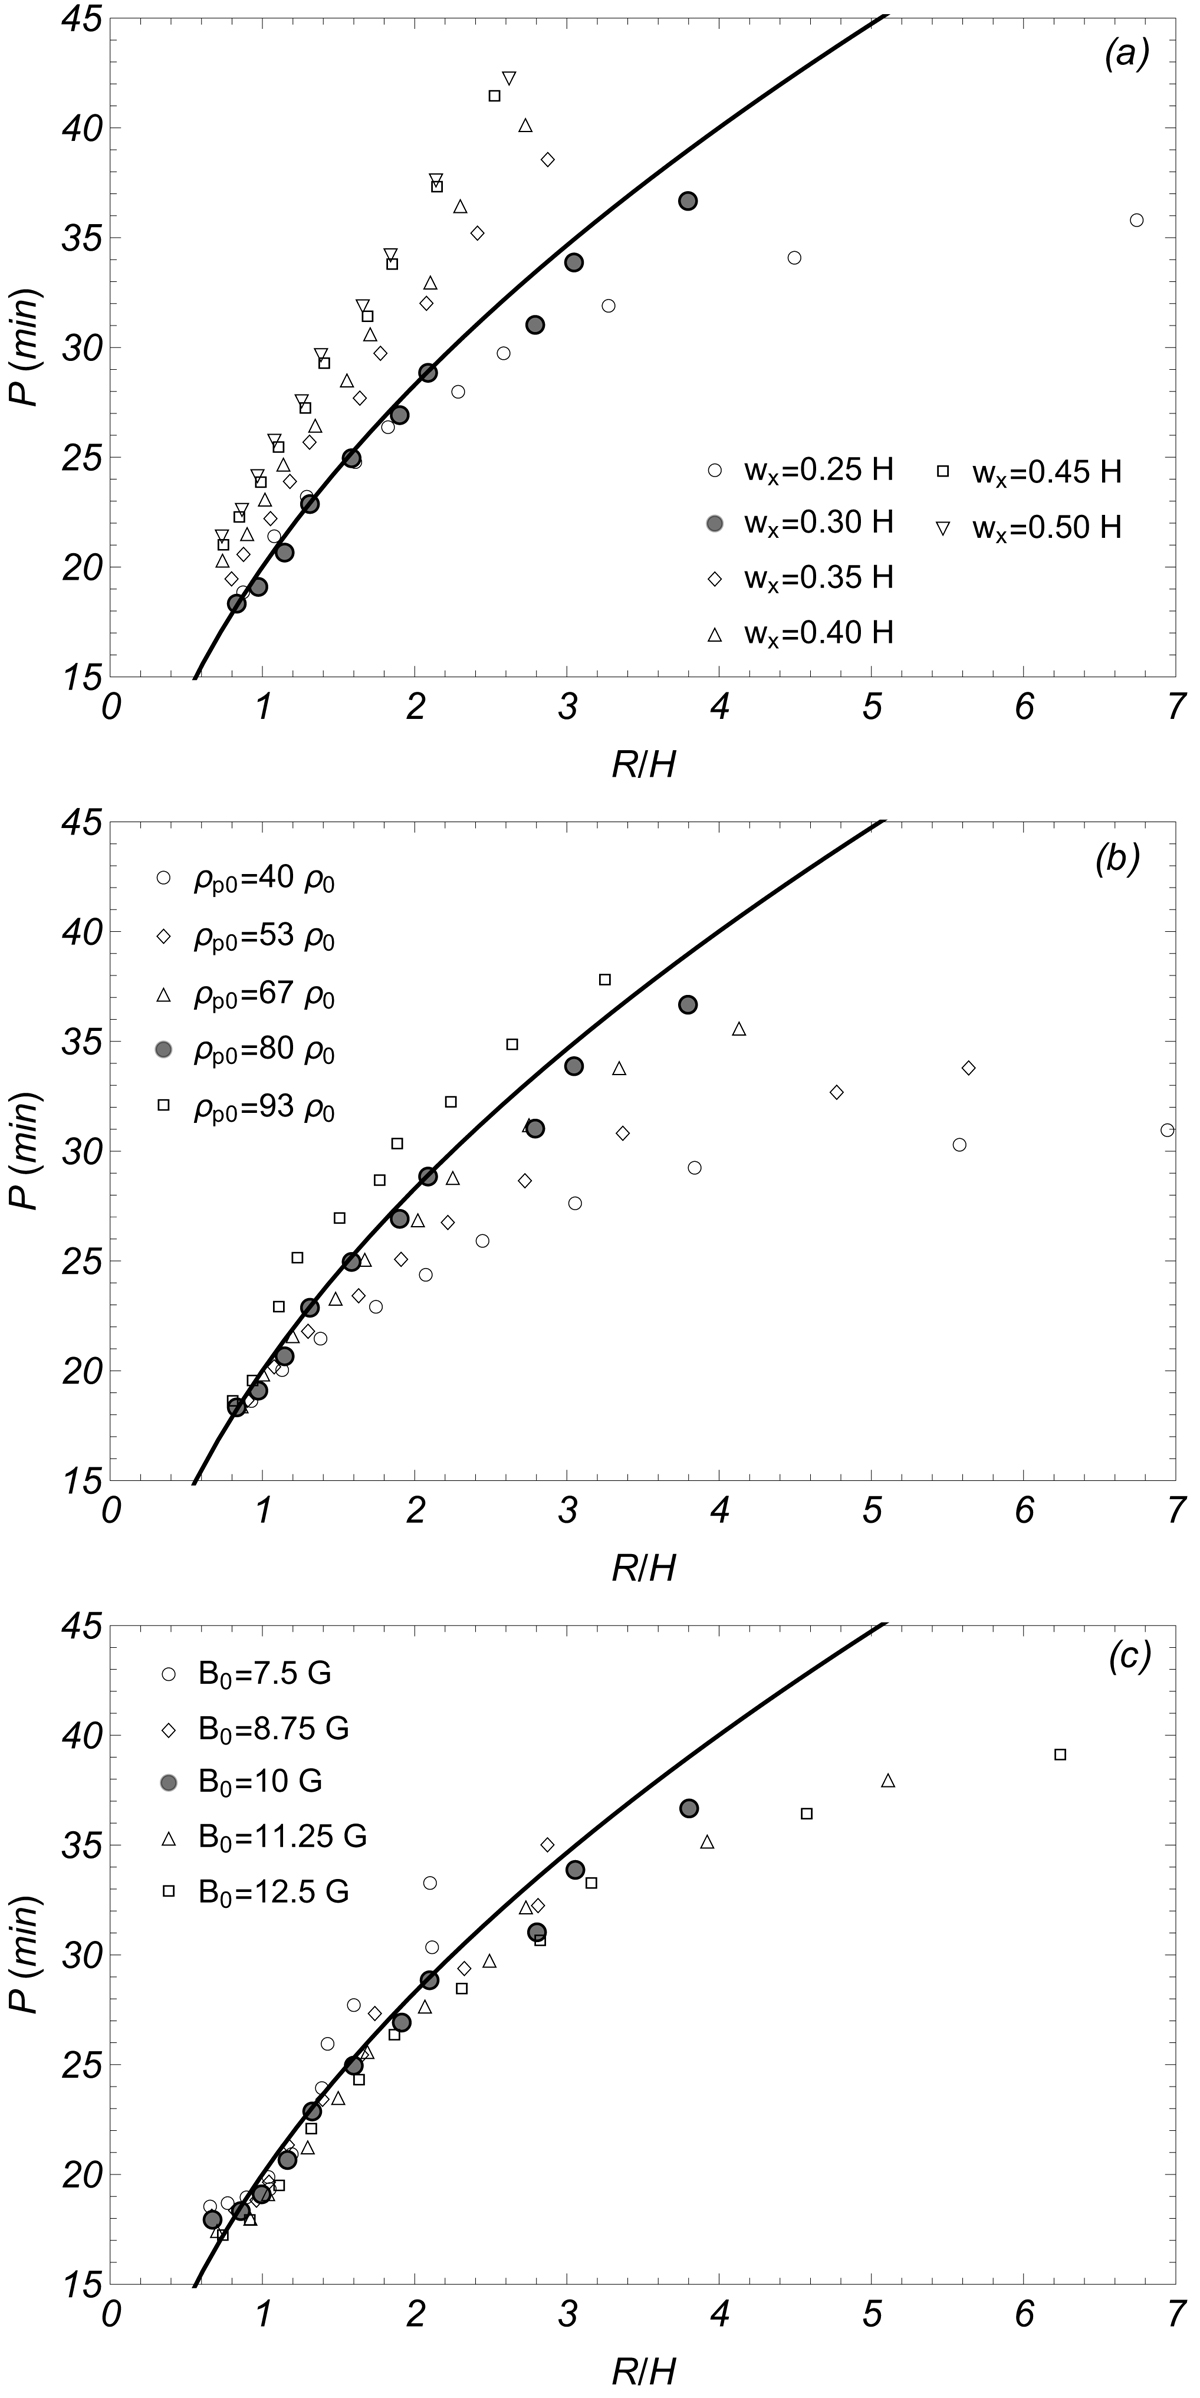
Scatter plots of the oscillation periods for longitudinal oscillations as a function of the radius of the field line curvature. The top panel represents the different cases as a function of wx, the middle panel as a function of ρp0, and the bottom panel as a function of B0. The filled circles correspond to the reference simulation. The solid line represents Eq. (1).
Current usage metrics show cumulative count of Article Views (full-text article views including HTML views, PDF and ePub downloads, according to the available data) and Abstracts Views on Vision4Press platform.
Data correspond to usage on the plateform after 2015. The current usage metrics is available 48-96 hours after online publication and is updated daily on week days.
Initial download of the metrics may take a while.