Open Access
Fig. 9.
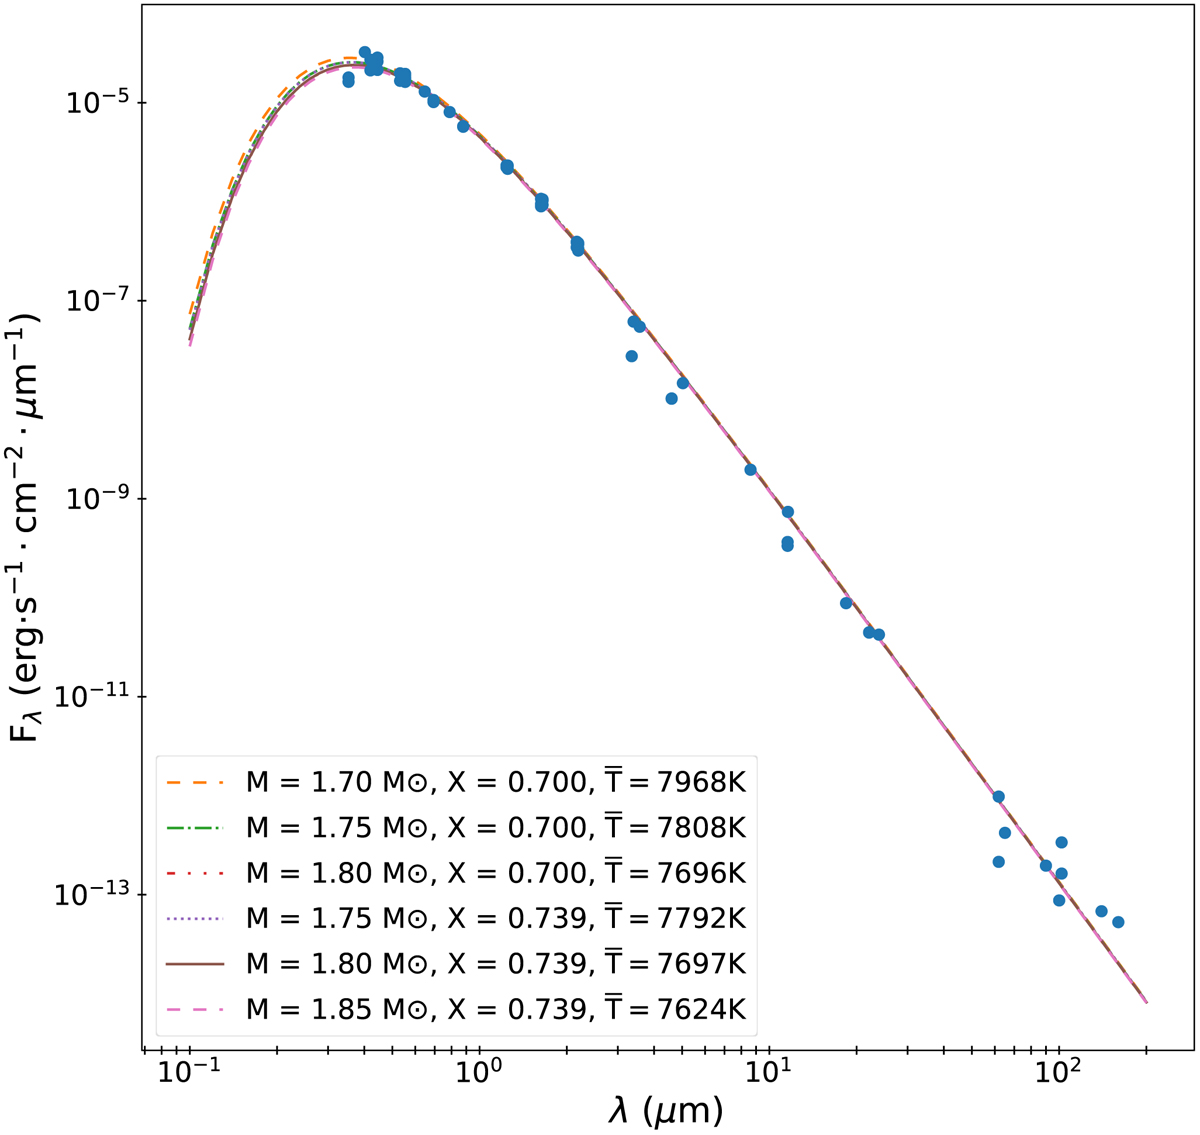
Spectral energy distribution produced in the direction of the observer (the inclination of the star being the one shown in Table 5), for different ESTER models with X = 0.700 and 0.739. ![]() is the mean surface temperature of the models. The blue dots correspond to the observed SED data from the Vizier website.
is the mean surface temperature of the models. The blue dots correspond to the observed SED data from the Vizier website.
Current usage metrics show cumulative count of Article Views (full-text article views including HTML views, PDF and ePub downloads, according to the available data) and Abstracts Views on Vision4Press platform.
Data correspond to usage on the plateform after 2015. The current usage metrics is available 48-96 hours after online publication and is updated daily on week days.
Initial download of the metrics may take a while.