Fig. 8.
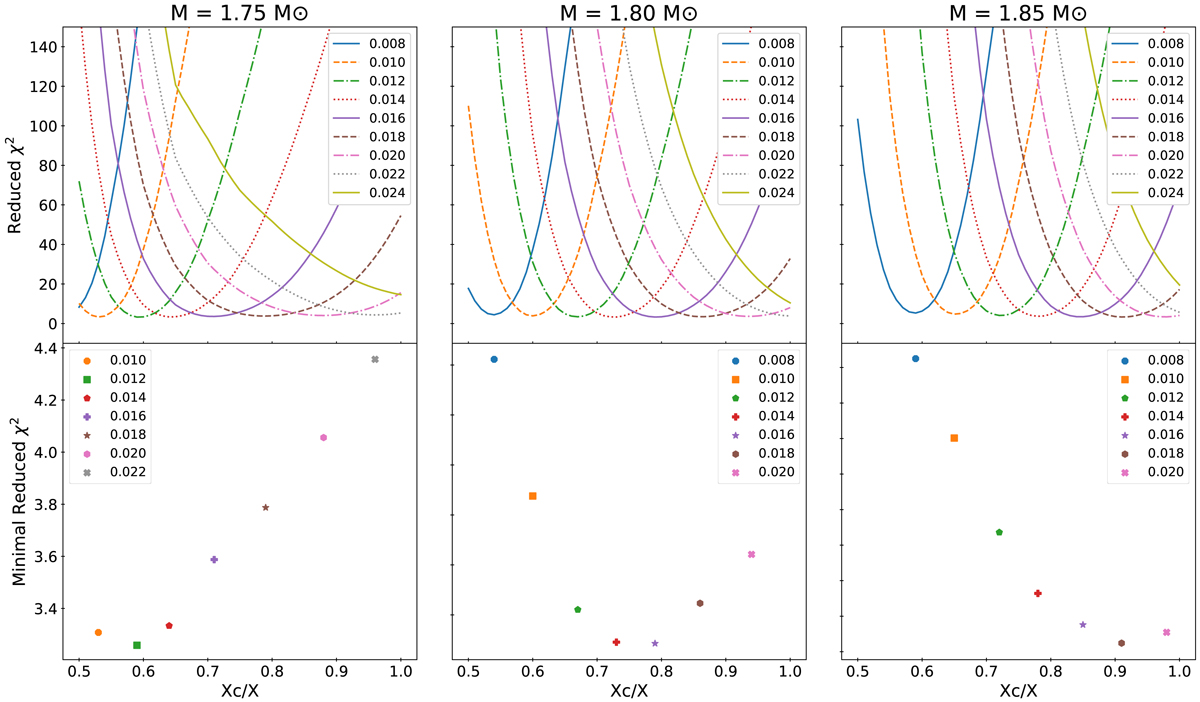
χ2 cuts at fixed Z values (upper row), and along the valley with low χ2 values (lower row), for X = 0.739. The points in the lower row correspond to the minima in the upper row. As can be seen, a definite minimum appears even within the valley with low χ2 values. Z values are shown in legend, and only the values for which the optimal Xc/X is in the range [0.5−1.0] are shown in the lower row.
Current usage metrics show cumulative count of Article Views (full-text article views including HTML views, PDF and ePub downloads, according to the available data) and Abstracts Views on Vision4Press platform.
Data correspond to usage on the plateform after 2015. The current usage metrics is available 48-96 hours after online publication and is updated daily on week days.
Initial download of the metrics may take a while.