Fig. 5.
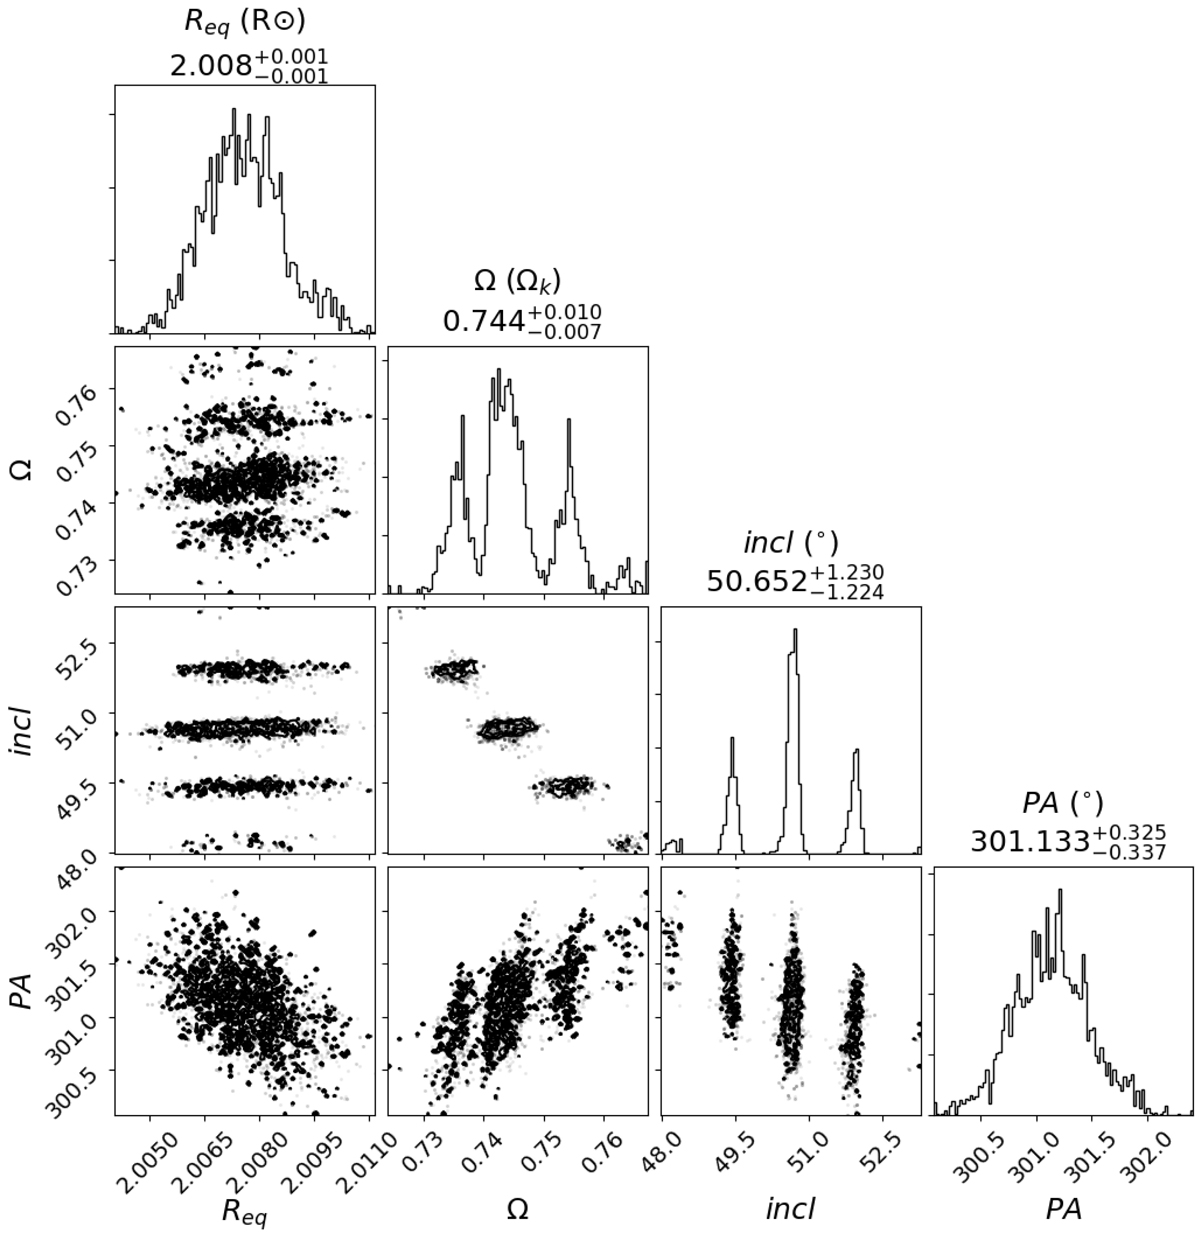
Corner plot showing the convergence of the MCMC model-fitting for Req, Ω, i, and PA, using interferometric observations (PIONIER + GRAVITY) and the ω-model. The run was made with 200 steps and 100 walkers. Only the last 50% steps are displayed here as convergence was met within the first 100 steps (“burn-in” phase). These results are listed in Table 5.
Current usage metrics show cumulative count of Article Views (full-text article views including HTML views, PDF and ePub downloads, according to the available data) and Abstracts Views on Vision4Press platform.
Data correspond to usage on the plateform after 2015. The current usage metrics is available 48-96 hours after online publication and is updated daily on week days.
Initial download of the metrics may take a while.