Open Access
Fig. 18.
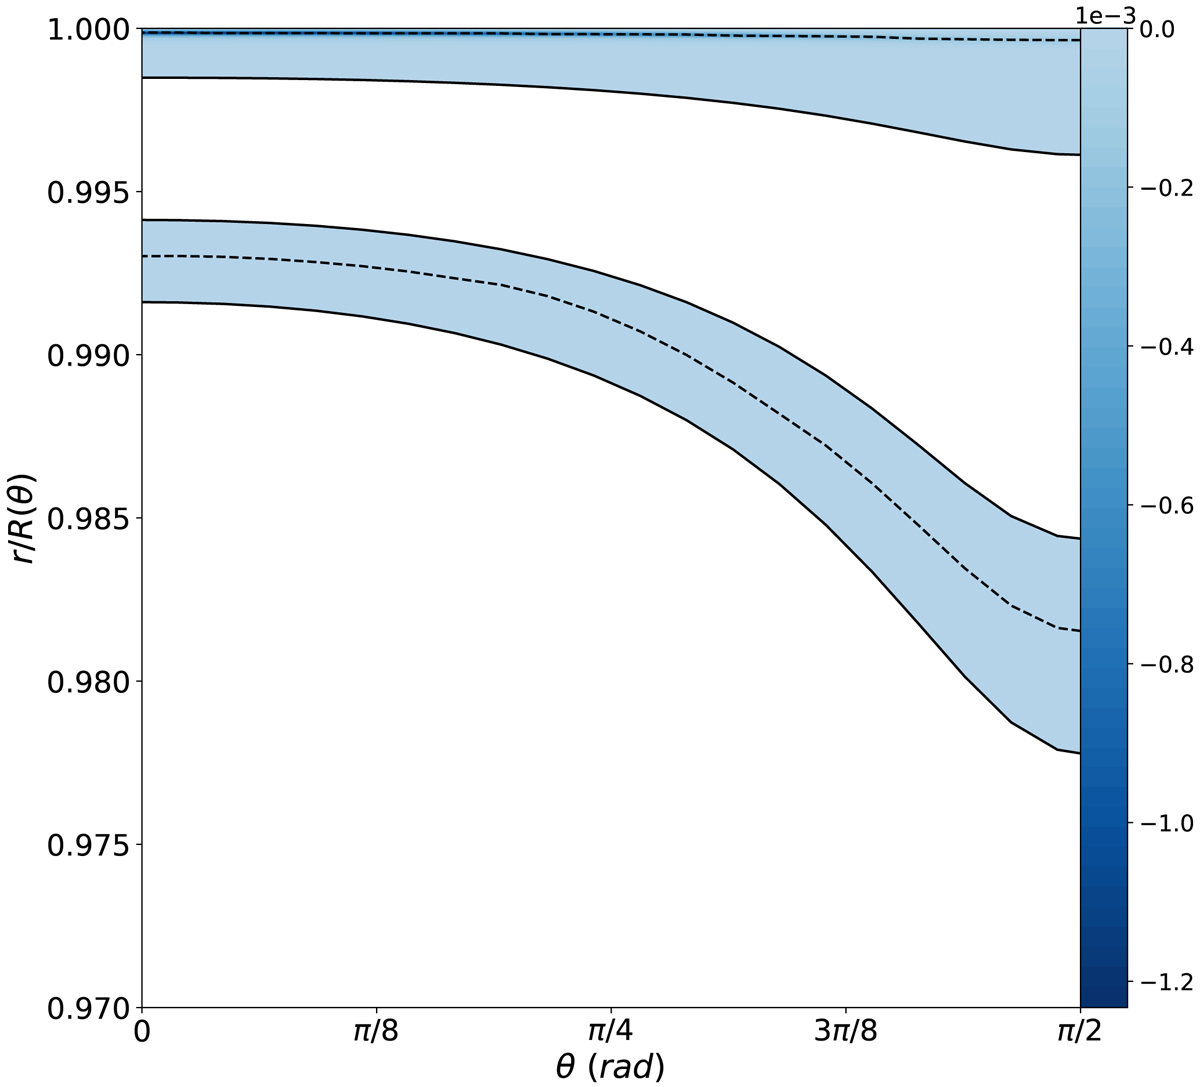
Squared Brunt-Väisälä frequency N2 of the final model, as a function of the radius r and colatitude θ. The thermally unstable layers (regions where N2 < 0), are colour-coded. These regions are bounded by solid lines, with a dashed line showing the minimum of N2 in this particular region.
Current usage metrics show cumulative count of Article Views (full-text article views including HTML views, PDF and ePub downloads, according to the available data) and Abstracts Views on Vision4Press platform.
Data correspond to usage on the plateform after 2015. The current usage metrics is available 48-96 hours after online publication and is updated daily on week days.
Initial download of the metrics may take a while.