Fig. 10.
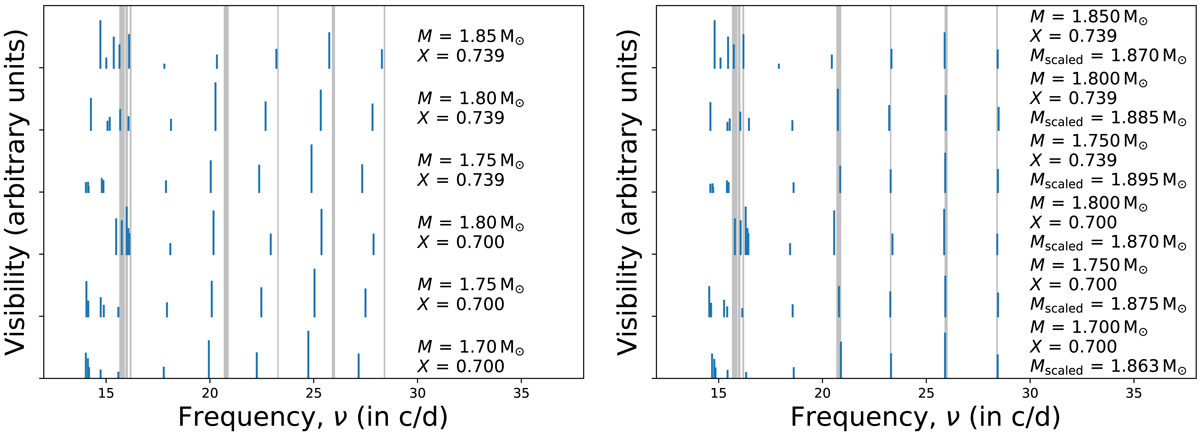
Observed and theoretical pulsations for Altair. The vertical grey lines that span the plots are the observed pulsations (modes f1 to f7). Their thicknesses are proportional to the observed amplitudes. The blue vertical segments are theoretical pulsations for six different ESTER models which satisfy Eqs. (14) and (15). The theoretical modes are successive m = 0, ![]() (or equivalently ℓ = 0 and 1) modes apart from the first mode (see text for details). The lengths of these segments are proportional to the disk-integrated mode visibilities. Left plot: theoretical frequencies whereas the right plot shows the same set of frequencies after applying a suitable homology scaling (e.g. Kippenhahn & Weigert 1990), thus leading to the scaled masses indicated on the figure (assuming the equatorial radius is fixed).
(or equivalently ℓ = 0 and 1) modes apart from the first mode (see text for details). The lengths of these segments are proportional to the disk-integrated mode visibilities. Left plot: theoretical frequencies whereas the right plot shows the same set of frequencies after applying a suitable homology scaling (e.g. Kippenhahn & Weigert 1990), thus leading to the scaled masses indicated on the figure (assuming the equatorial radius is fixed).
Current usage metrics show cumulative count of Article Views (full-text article views including HTML views, PDF and ePub downloads, according to the available data) and Abstracts Views on Vision4Press platform.
Data correspond to usage on the plateform after 2015. The current usage metrics is available 48-96 hours after online publication and is updated daily on week days.
Initial download of the metrics may take a while.