Fig. 5
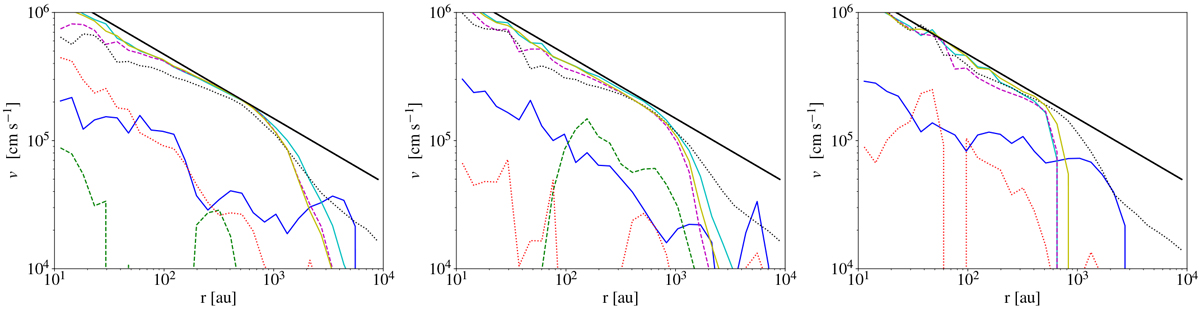
Velocity profiles at t = 16 tdyn for the different runs. Left panel: A1 (blue solid), A1_t (green dashed), A1_t_nw (red dotted), I1 (cyan solid), I1_t (purple dashed), I1_t_nw (black dotted), and IrrI1_t (yellow solid); middle panel: A2 (blue solid), A2_t (green dashed), A2_t_nw (red dotted), I2 (cyan solid), I2_t (purple dashed), I2_t_nw (black dotted), and IrrI2_t (yellow solid); right panel: A3 (blue solid), A3_t (green dashed), A3_t_nw (red dotted), I3 (cyan solid), I3_t (purple dashed), I3_t_nw (black dotted), and IrrI3_t (yellow solid). The black solid line corresponds to the Keplerian velocity
![]() for a star with mass M = 2.5 M⊙.
for a star with mass M = 2.5 M⊙.
Current usage metrics show cumulative count of Article Views (full-text article views including HTML views, PDF and ePub downloads, according to the available data) and Abstracts Views on Vision4Press platform.
Data correspond to usage on the plateform after 2015. The current usage metrics is available 48-96 hours after online publication and is updated daily on week days.
Initial download of the metrics may take a while.