Fig. A.10.
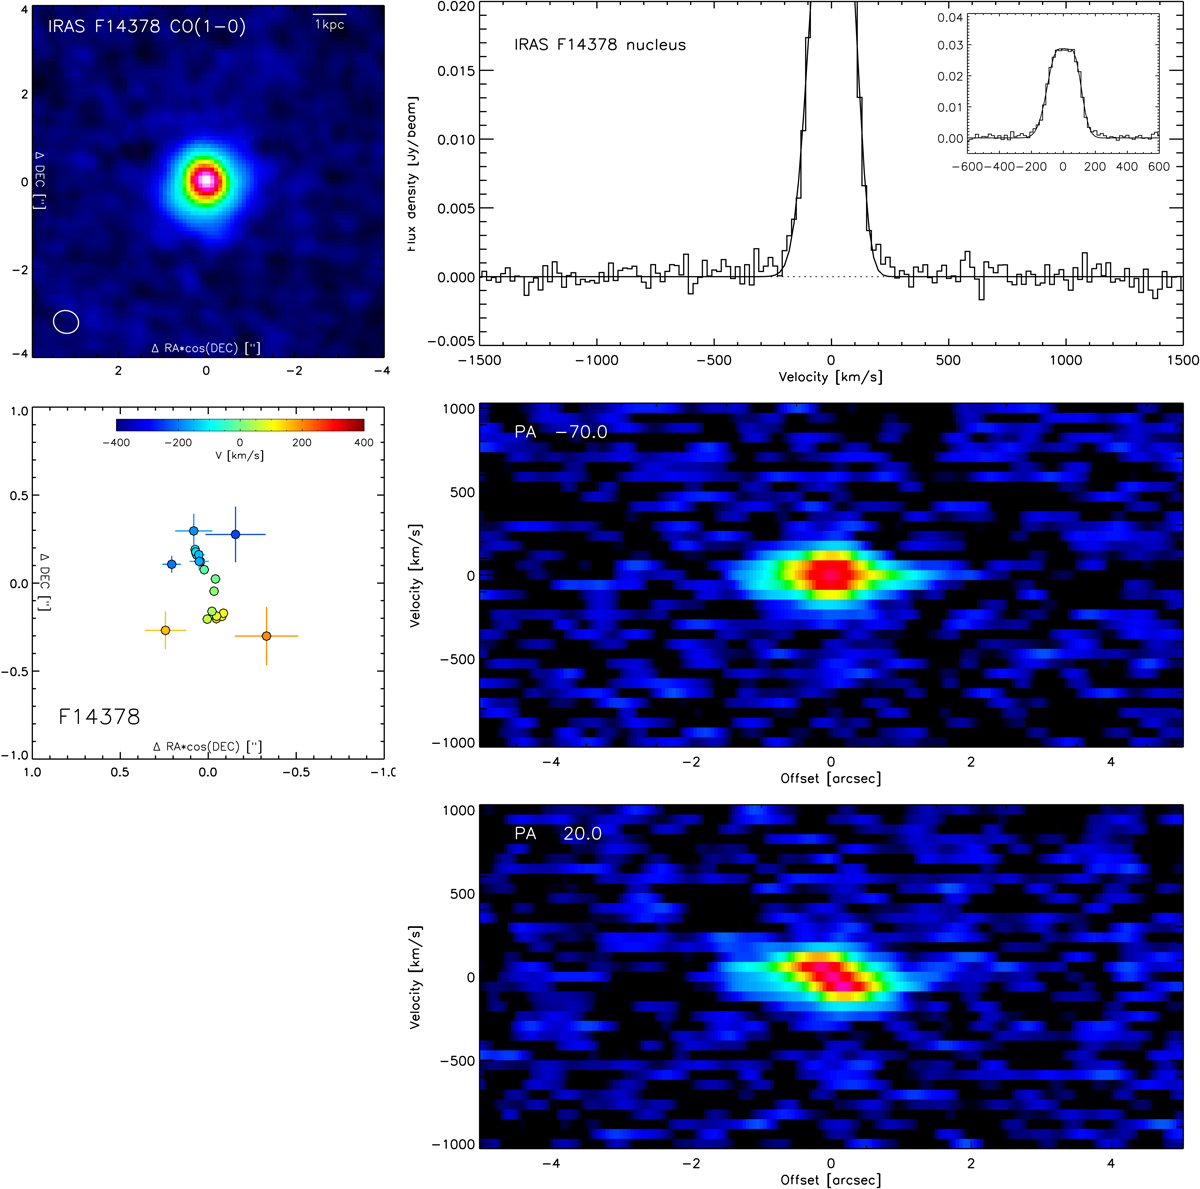
ALMA CO(1-0) data for IRAS F14378−3651. Top left: moment-zero map. Top right: spectrum centered on the continuum nucleus. The host spectrum is fit with two Gaussians, their sum is overplotted in black. We conservatively assign an upper limit to molecular outflow, since the nature of the weak line wings at ±250 km s−1 is unclear. Center left: center positions and their errors, from UV fitting a Gaussian model to individual velocity channels. Center and bottom right: position-velocity diagrams, along the line core velocity gradient at PA ∼20° and orthogonal to it.
Current usage metrics show cumulative count of Article Views (full-text article views including HTML views, PDF and ePub downloads, according to the available data) and Abstracts Views on Vision4Press platform.
Data correspond to usage on the plateform after 2015. The current usage metrics is available 48-96 hours after online publication and is updated daily on week days.
Initial download of the metrics may take a while.