Fig. A.8.
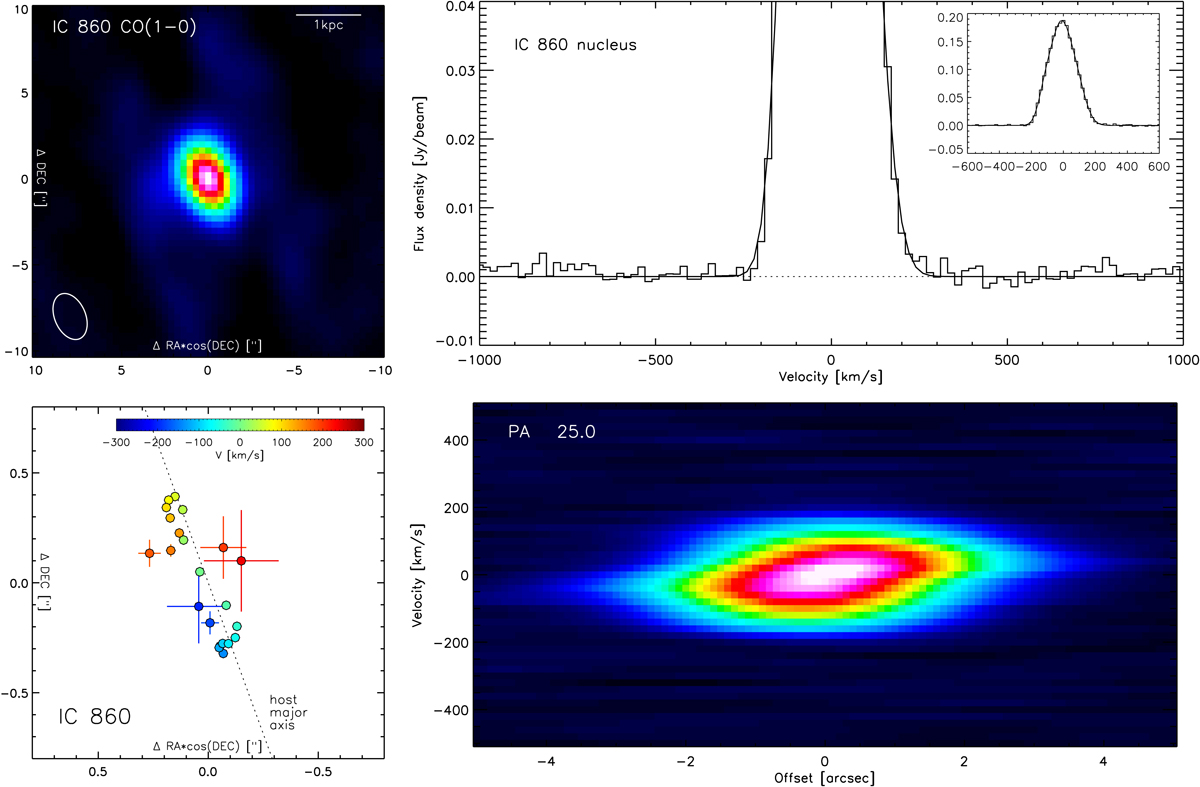
NOEMA CO(1-0) data for IC 860. Top left: moment-zero map. Top right: spectrum centered on the continuum nucleus. The host spectrum is fit with three Gaussians, their sum is overplotted in black. We conservatively assign an upper limit to a CO outflow. Bottom left: center positions and their errors, from UV fitting a Gaussian model to individual velocity channels. The dotted line indicates the 2MASS extended source catalog K-band major axis PA 20° of the stellar host. Bottom right: position-velocity diagram at PA +25 deg, close to the velocity gradient of the line core and to the host major axis.
Current usage metrics show cumulative count of Article Views (full-text article views including HTML views, PDF and ePub downloads, according to the available data) and Abstracts Views on Vision4Press platform.
Data correspond to usage on the plateform after 2015. The current usage metrics is available 48-96 hours after online publication and is updated daily on week days.
Initial download of the metrics may take a while.