Fig. A.4.
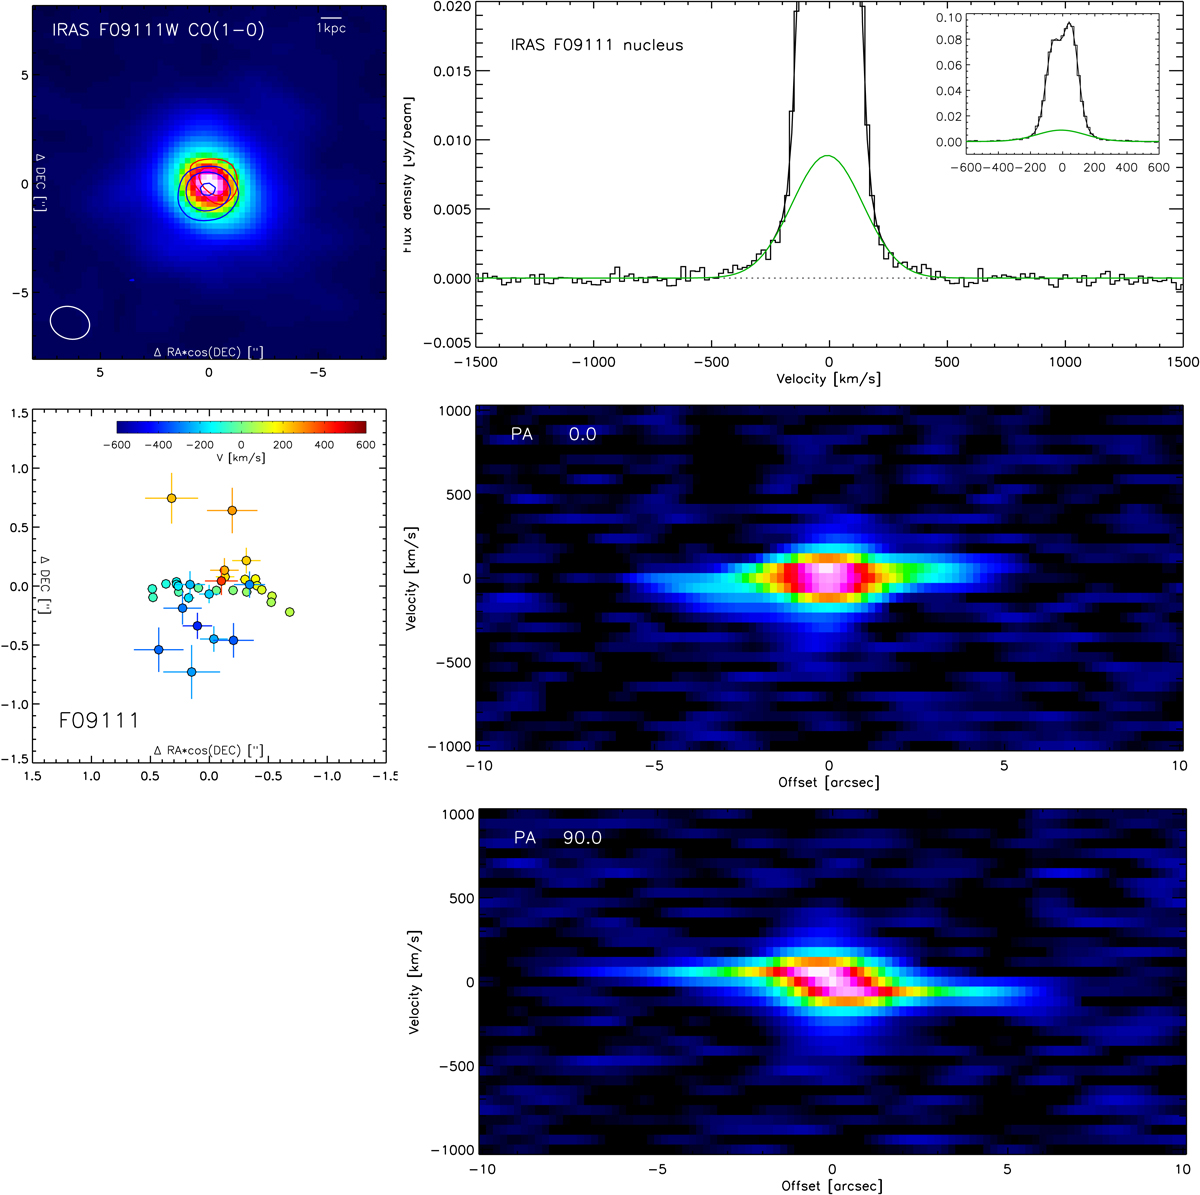
ALMA CO(1-0) data for IRAS F09111−1007W. Top left: moment-zero map. Overplotted are contours for outflow in the range [−510, −210] km s−1 (blue) and [210, 510] km s−1 (red), with contours at [0.35, 0.6, 1.1] mJy beam−1. Top right: spectrum centered on the continuum nucleus. The spectrum is decomposed into three Gaussians, two for the host line profile and one for outflow (green). The black line includes all three Gaussian components. Outflow wings are detected on both sides of the line core. Center left: center positions and their errors, from UV fitting a Gaussian model to individual velocity channels. Center and bottom right: position-velocity diagrams. PA 0° is close to the bipolar outflow orientation, and orthogonal to the velocity gradient of the line core at PA ∼90°.
Current usage metrics show cumulative count of Article Views (full-text article views including HTML views, PDF and ePub downloads, according to the available data) and Abstracts Views on Vision4Press platform.
Data correspond to usage on the plateform after 2015. The current usage metrics is available 48-96 hours after online publication and is updated daily on week days.
Initial download of the metrics may take a while.