Fig. A.1.
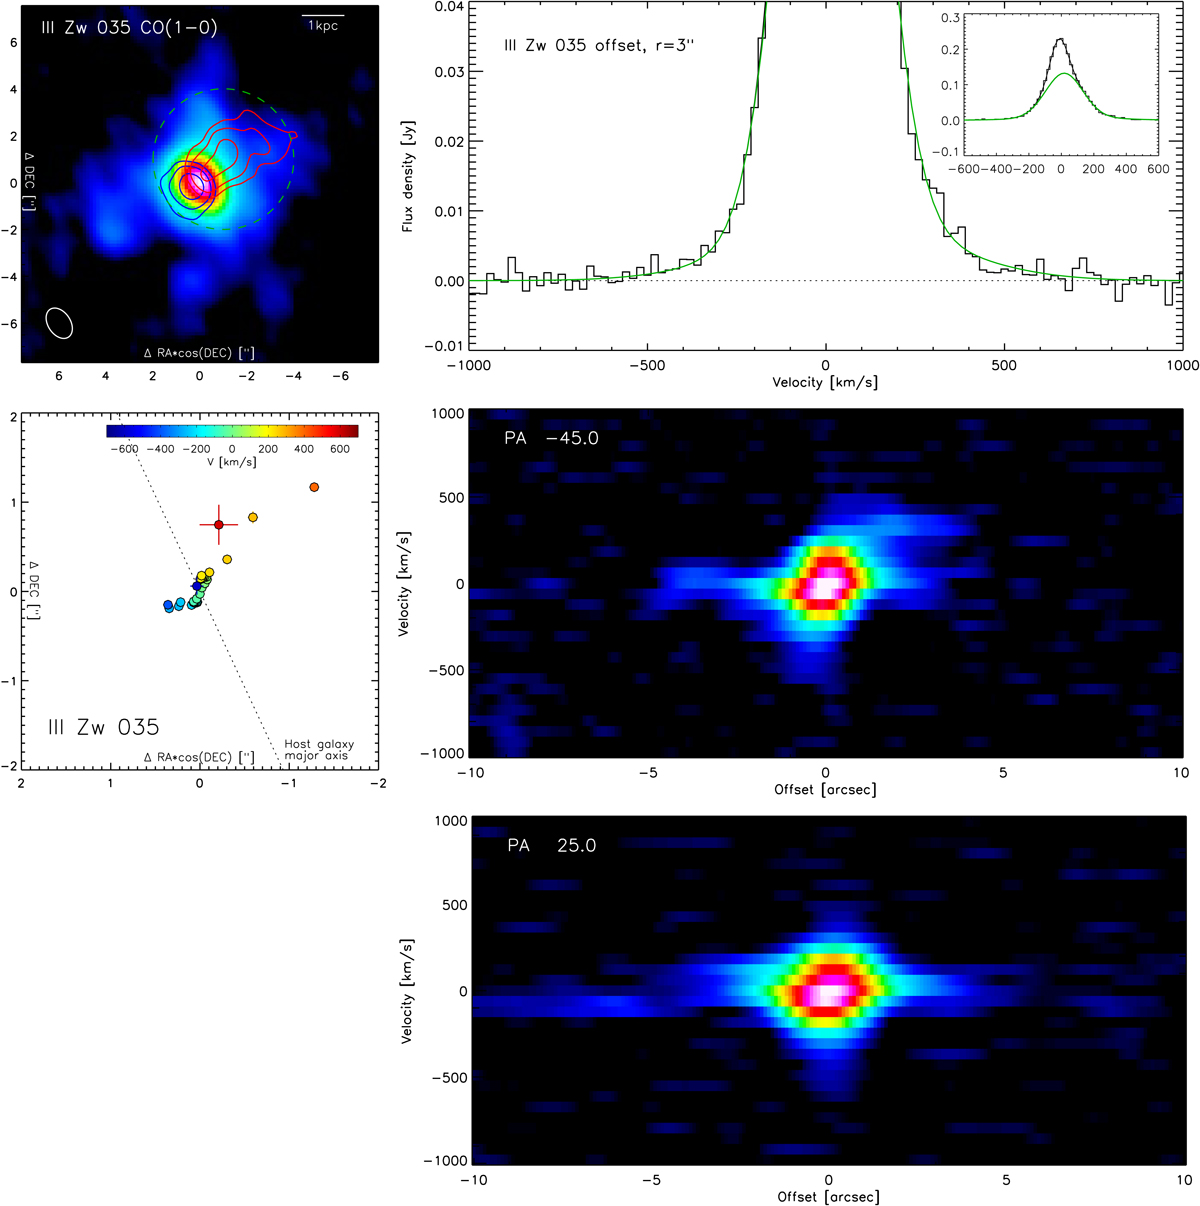
NOEMA CO(1-0) data for III Zw 035. Top left: moment-zero map. All spatial offsets are in arcseconds relative to the position of the 3 mm continuum (Table 2). North is to the top and east to the left. Overlaid contours are for outflow in the velocity range [−570, −270] km s−1 (blue) and [270, 570] km s−1 (red), with contours at [0.3, 0.6, 1.2] mJy beam−1. Top right: spectrum in a r = 3″ aperture offset from the continuum nucleus by −1″ in RA × cos(Dec) and +1″ in Dec (green dashed circle in top left panel). The spectrum is decomposed into three Gaussians, one for host and two for outflow (green). The black line includes all three Gaussian components. Center left: center positions and their errors for selected velocity channels. These are derived by fitting a Gaussian model to the UV data for the respective velocity channel. North is to the top and east to the left. The dotted line marks the galaxy major axis position angle ∼25° (Kim et al. 2013). Center right: position-velocity diagram along the direction of the strong red outflow at PA −45°. Bottom right: position-velocity diagram along the galaxy major axis PA 25°. The fainter galaxy of the pair is located near offset −7″ in this PV diagram but does not stand out clearly from the major emission of the galaxy. We detect a strong and asymmetric bipolar outflow.
Current usage metrics show cumulative count of Article Views (full-text article views including HTML views, PDF and ePub downloads, according to the available data) and Abstracts Views on Vision4Press platform.
Data correspond to usage on the plateform after 2015. The current usage metrics is available 48-96 hours after online publication and is updated daily on week days.
Initial download of the metrics may take a while.