Fig. 6.
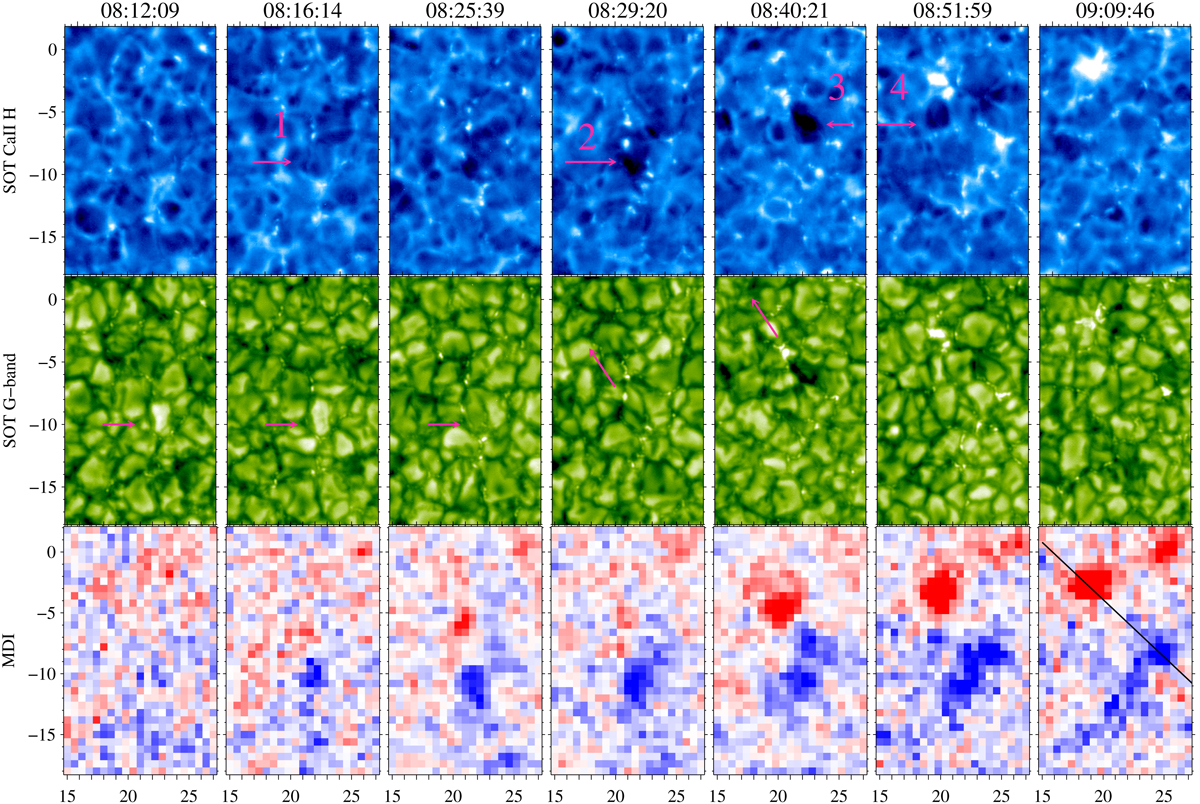
Overview of the evolution of the EFR (green rectangle in Fig. 2) at the lower atmosphere, in Hinode/SOT Ca II H (top row), G-band (middle row), and MDI (bottom row). The line in the last panel of the bottom row marks the area where the space-time slices of Fig. 8 were taken. Arrows indicate specific emergence events and features of interest (see main text). The magnetic field strength is scaled between ±40 G.
Current usage metrics show cumulative count of Article Views (full-text article views including HTML views, PDF and ePub downloads, according to the available data) and Abstracts Views on Vision4Press platform.
Data correspond to usage on the plateform after 2015. The current usage metrics is available 48-96 hours after online publication and is updated daily on week days.
Initial download of the metrics may take a while.