Fig. 5.
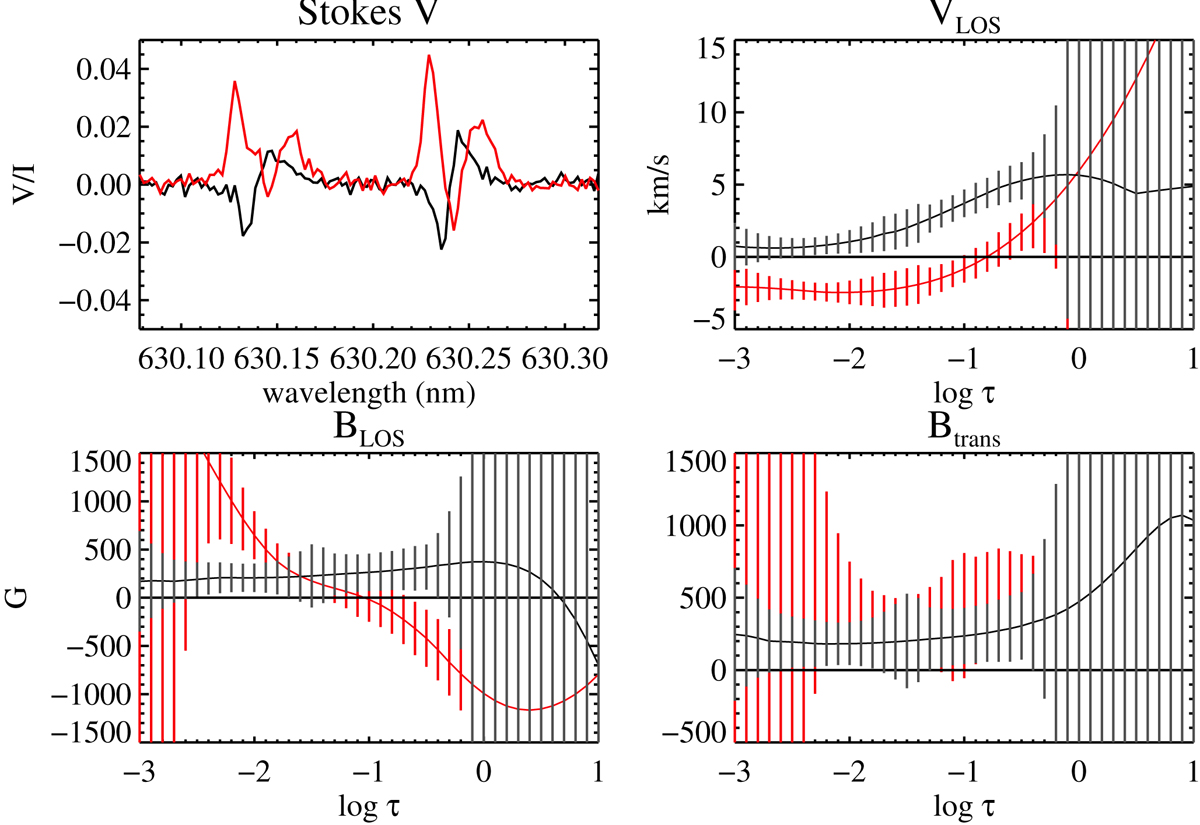
From upper left to lower right: Stokes V profiles of the Fe I 6301 Å and 6302 Å lines, VLOS, BLOS and Btrans calculated through spectropolarimetric inversions for the pixel marked with the yellow cross in Fig. 4. Red lines represent measurements and results for the raster taken between 09:15 and 09:25 UT while the black lines represent the same pixel of the raster taken 10 min earlier.
Current usage metrics show cumulative count of Article Views (full-text article views including HTML views, PDF and ePub downloads, according to the available data) and Abstracts Views on Vision4Press platform.
Data correspond to usage on the plateform after 2015. The current usage metrics is available 48-96 hours after online publication and is updated daily on week days.
Initial download of the metrics may take a while.