Fig. 4.
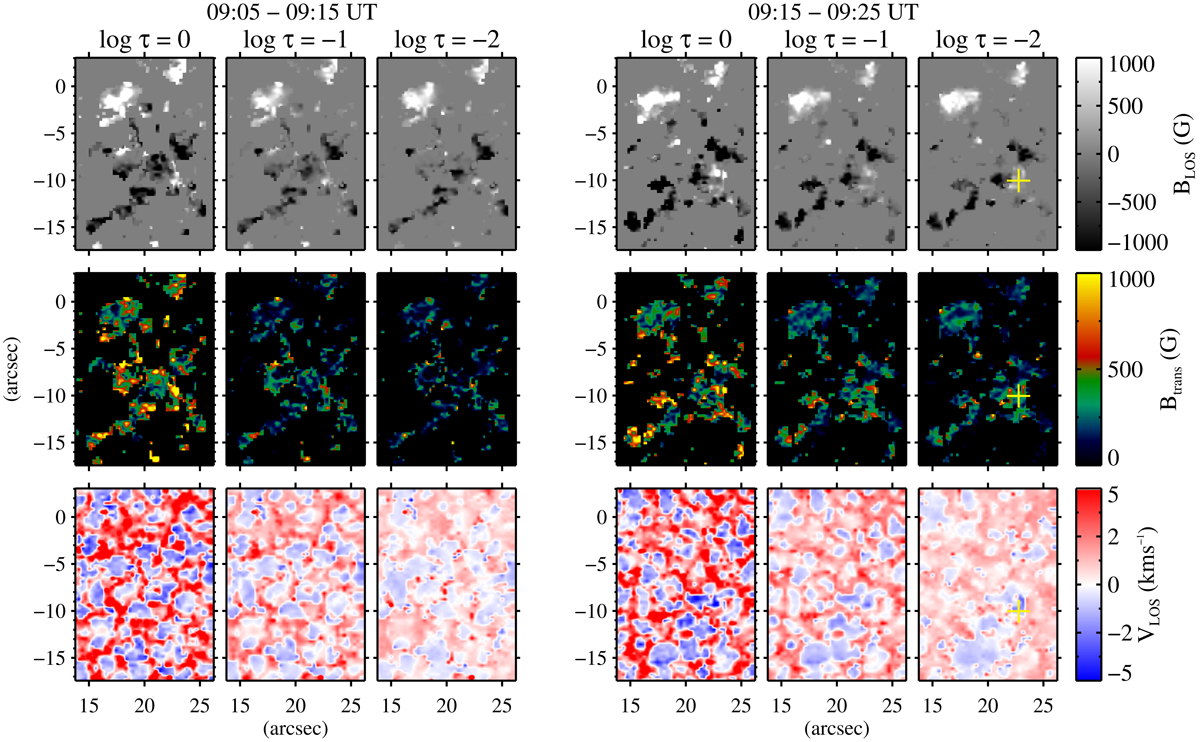
Results of the spectropolarimetric inversions with SIR, for the raster scans of Hinode/SP taken at 09:05 UT (left) and 09:15 UT (right). Columns correspond to different τ values while rows from top to bottom correspond to the LOS and transversal component of the magnetic field, BLOS and Btrans (which correspond to the vertical and horizontal components, correspondingly, since the region is located at the disk center), and the LOS component of the Doppler velocity, VLOS. The yellow crosses mark the pixel whose profiles are shown in Fig. 5. Magnetic field results are shown for pixels with total polarization higher than 5%. The magnetic field values in the map are clipped between ±1000 G and the values of the velocity between ±5 km s−1.
Current usage metrics show cumulative count of Article Views (full-text article views including HTML views, PDF and ePub downloads, according to the available data) and Abstracts Views on Vision4Press platform.
Data correspond to usage on the plateform after 2015. The current usage metrics is available 48-96 hours after online publication and is updated daily on week days.
Initial download of the metrics may take a while.