Free Access
Fig. 13.
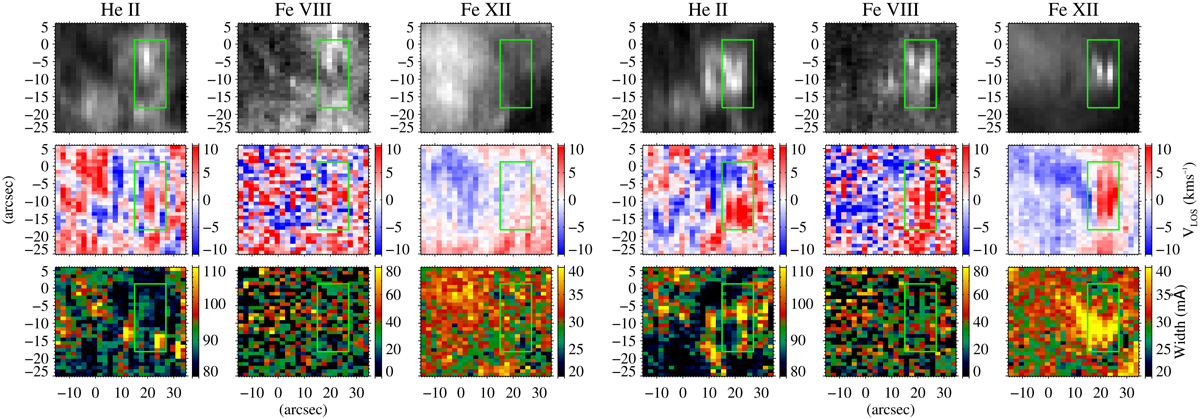
From left to right: spectral-line parameters for the three spectral lines, He II, Fe VIII, and Fe XII of the two EIS scans, the scan between 09:01 and 09:20 UT, and the scan between 10:25 and 10:44 UT (left and right panels, respectively). Rows from top to bottom contain intensity, LOS velocity, and spectral line width.
Current usage metrics show cumulative count of Article Views (full-text article views including HTML views, PDF and ePub downloads, according to the available data) and Abstracts Views on Vision4Press platform.
Data correspond to usage on the plateform after 2015. The current usage metrics is available 48-96 hours after online publication and is updated daily on week days.
Initial download of the metrics may take a while.