Free Access
Fig. 4.
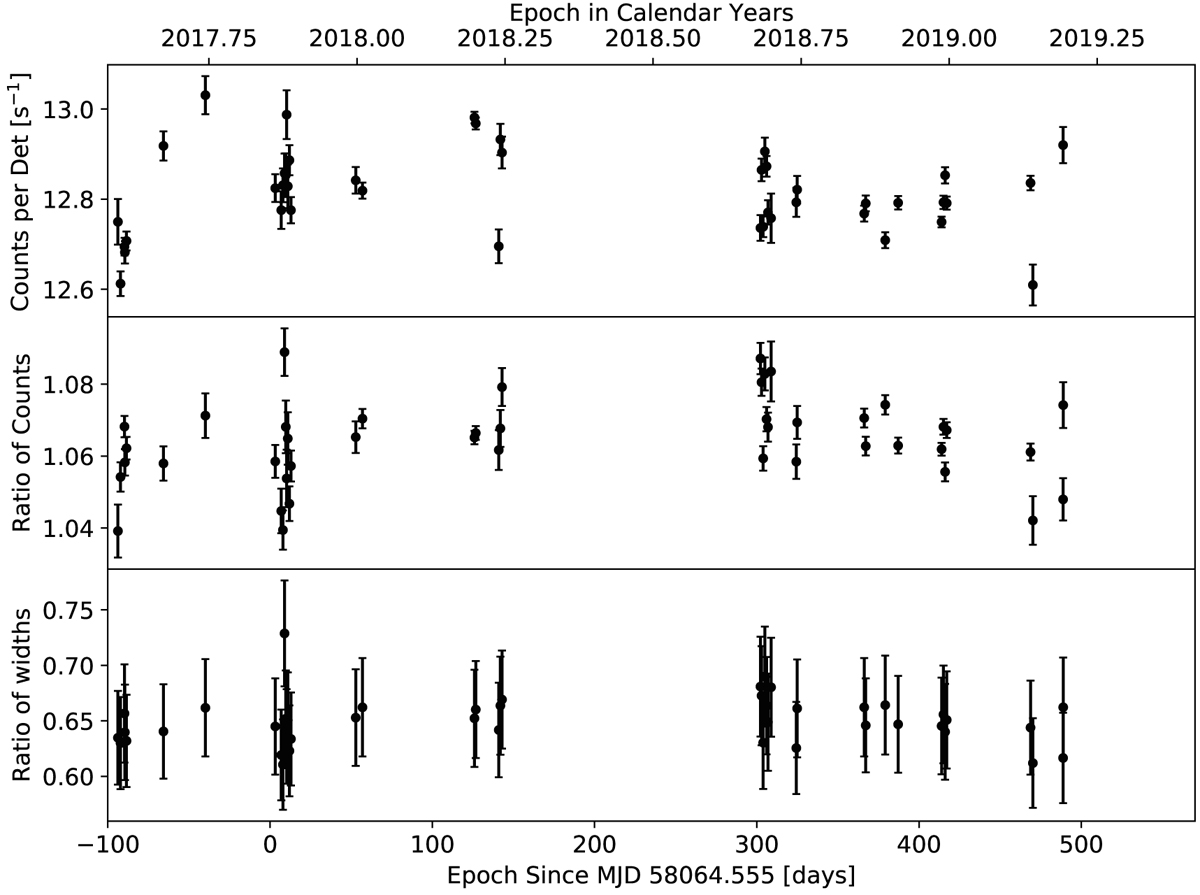
Variation of pulse properties as a function of epoch. Top to bottom panels: average onpulse X-ray flux of the Crab pulsar (photons per second per detector in the energy range 0.2 − 12 KeV), ratio of the average fluxes of the main and inter pulse, and ratio of the rms widths of the main and inter pulse, respectively.
Current usage metrics show cumulative count of Article Views (full-text article views including HTML views, PDF and ePub downloads, according to the available data) and Abstracts Views on Vision4Press platform.
Data correspond to usage on the plateform after 2015. The current usage metrics is available 48-96 hours after online publication and is updated daily on week days.
Initial download of the metrics may take a while.