Free Access
Fig. 3.
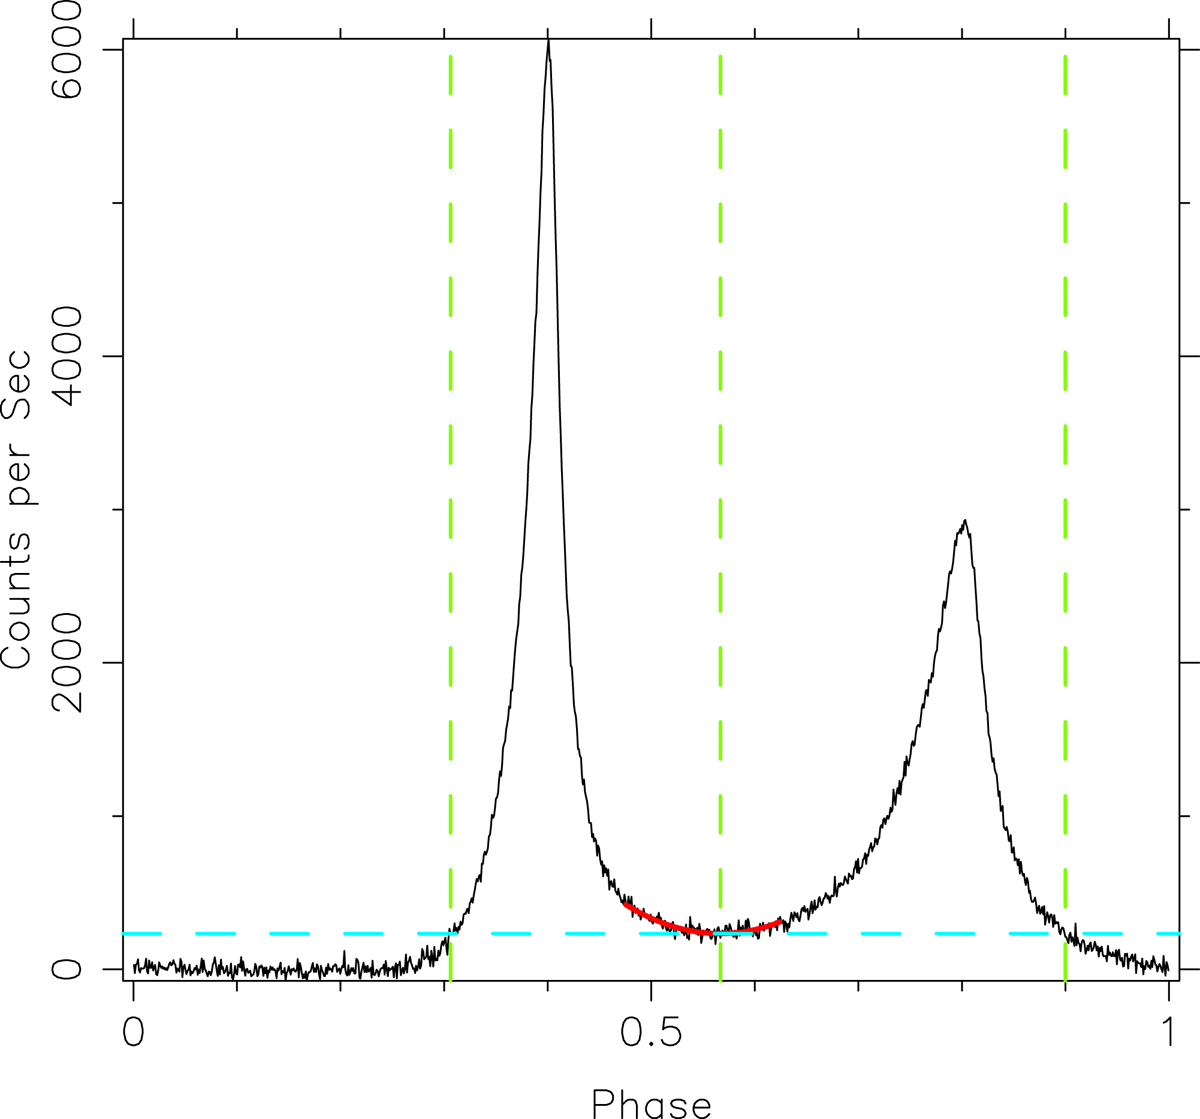
Integrated profile of the Crab pulsar for the data of ObsID 1013010143. The solid red curve between the two pulse components, and the horizontal and vertical dashed lines define the two pulse components for the purpose of parameter estimation; they are explained in the text.
Current usage metrics show cumulative count of Article Views (full-text article views including HTML views, PDF and ePub downloads, according to the available data) and Abstracts Views on Vision4Press platform.
Data correspond to usage on the plateform after 2015. The current usage metrics is available 48-96 hours after online publication and is updated daily on week days.
Initial download of the metrics may take a while.