Fig. 2.
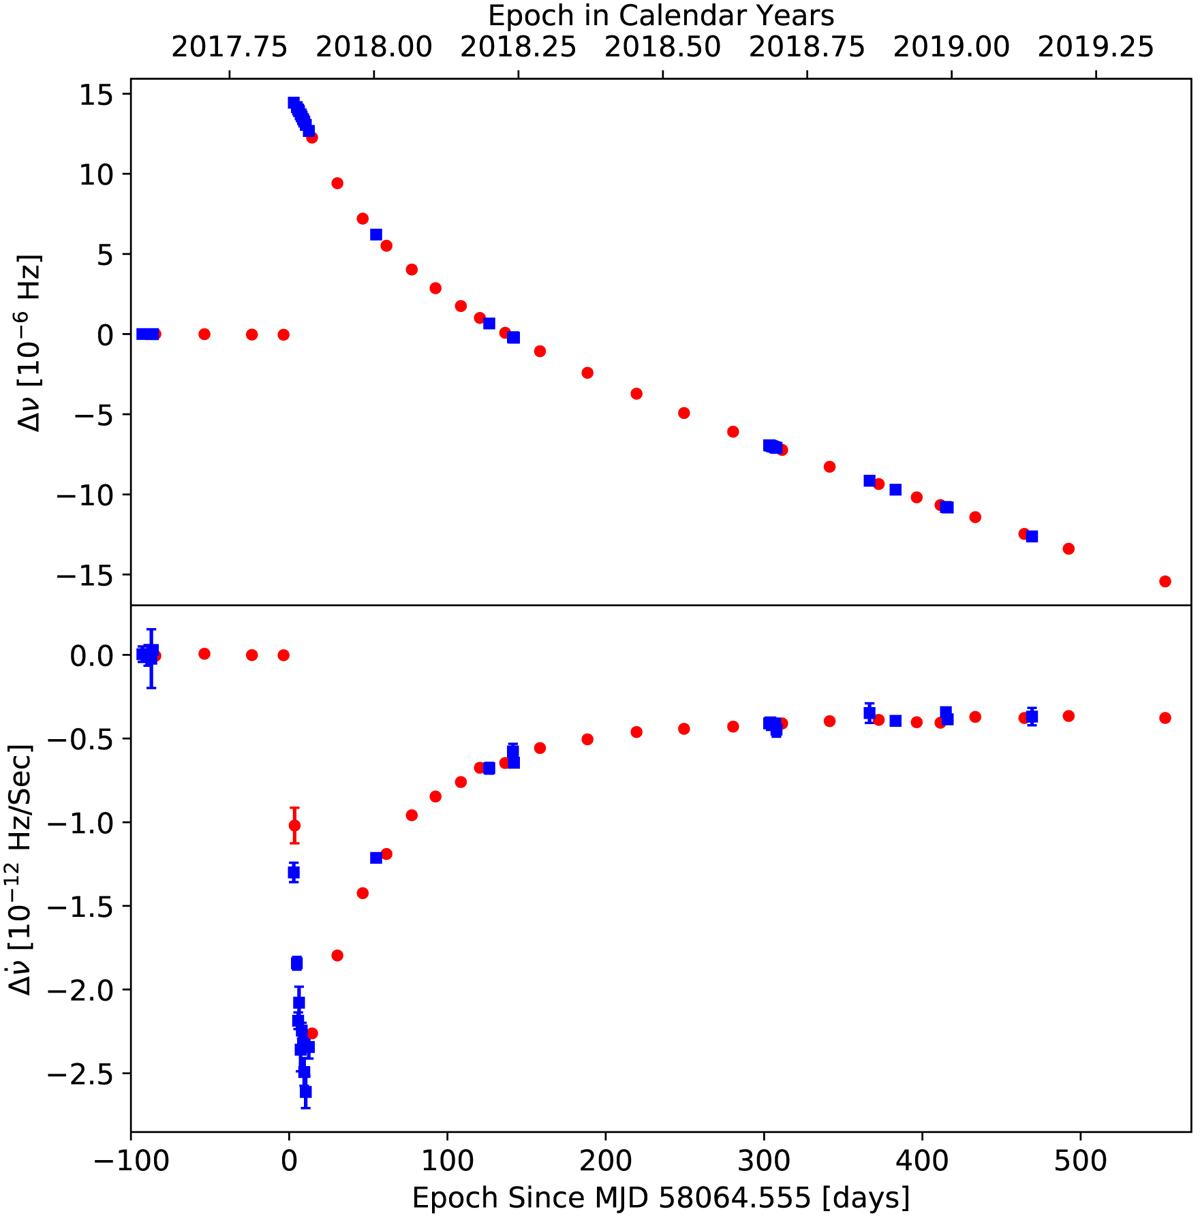
Variation of ν and ![]() as a function of epoch. Dots are data from the JBCPME (Lyne et al. 1993), while the boxes are NICER data. The change in rotation frequency Δν (top panel) and the change in the frequency derivative
as a function of epoch. Dots are data from the JBCPME (Lyne et al. 1993), while the boxes are NICER data. The change in rotation frequency Δν (top panel) and the change in the frequency derivative ![]() (bottom panel) are measured with respect to the preglitch reference timing model obtained from the preglitch JBCPME data.
(bottom panel) are measured with respect to the preglitch reference timing model obtained from the preglitch JBCPME data.
Current usage metrics show cumulative count of Article Views (full-text article views including HTML views, PDF and ePub downloads, according to the available data) and Abstracts Views on Vision4Press platform.
Data correspond to usage on the plateform after 2015. The current usage metrics is available 48-96 hours after online publication and is updated daily on week days.
Initial download of the metrics may take a while.