Fig. 2.
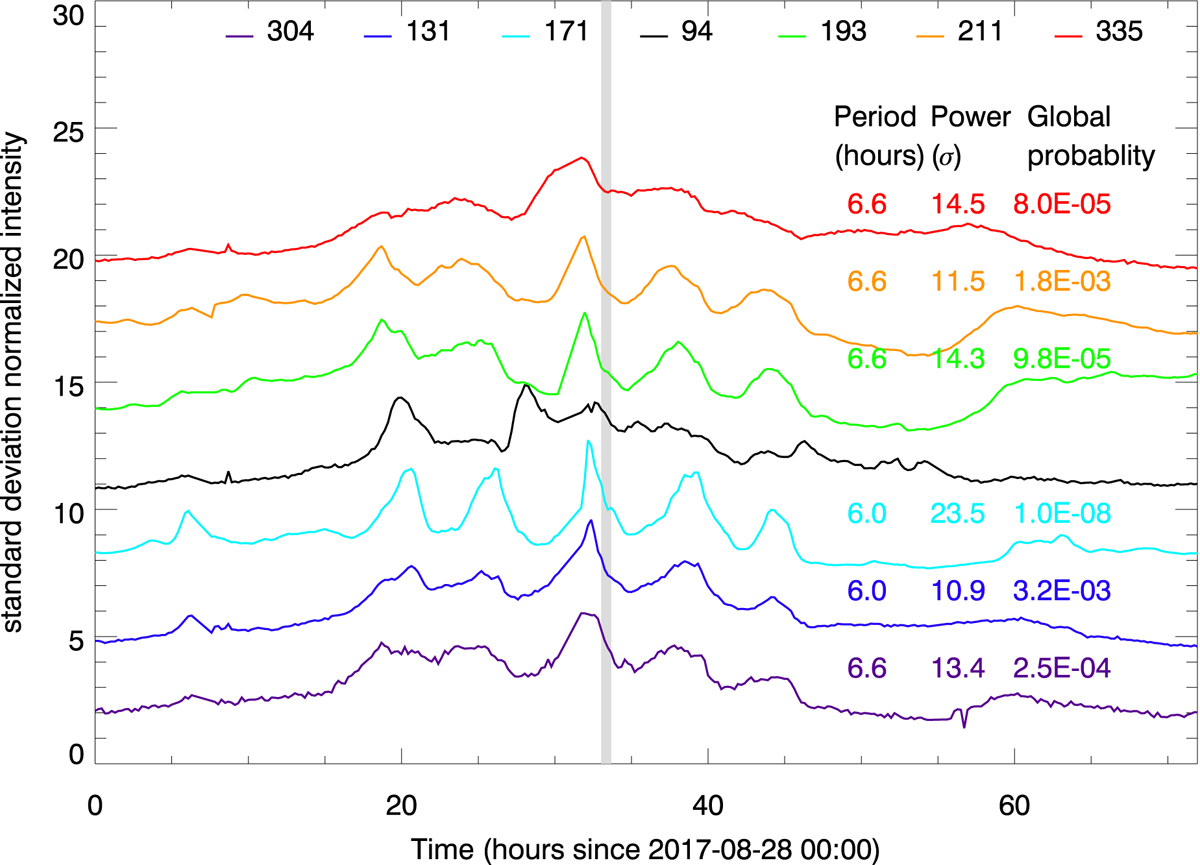
Evolution of the intensity for seven AIA channels for three days, starting at 2017-08-28 00:00 UT. These time series are averaged over the black contour displayed in Fig. 1. All the light curves are normalised to standard deviation and offset by arbitrary numbers on the y-axis. For each curve, we display the corresponding period, Fourier power and the associated random occurrence probability. The grey bar indicates the duration of the SST observations.
Current usage metrics show cumulative count of Article Views (full-text article views including HTML views, PDF and ePub downloads, according to the available data) and Abstracts Views on Vision4Press platform.
Data correspond to usage on the plateform after 2015. The current usage metrics is available 48-96 hours after online publication and is updated daily on week days.
Initial download of the metrics may take a while.