Fig. 3.
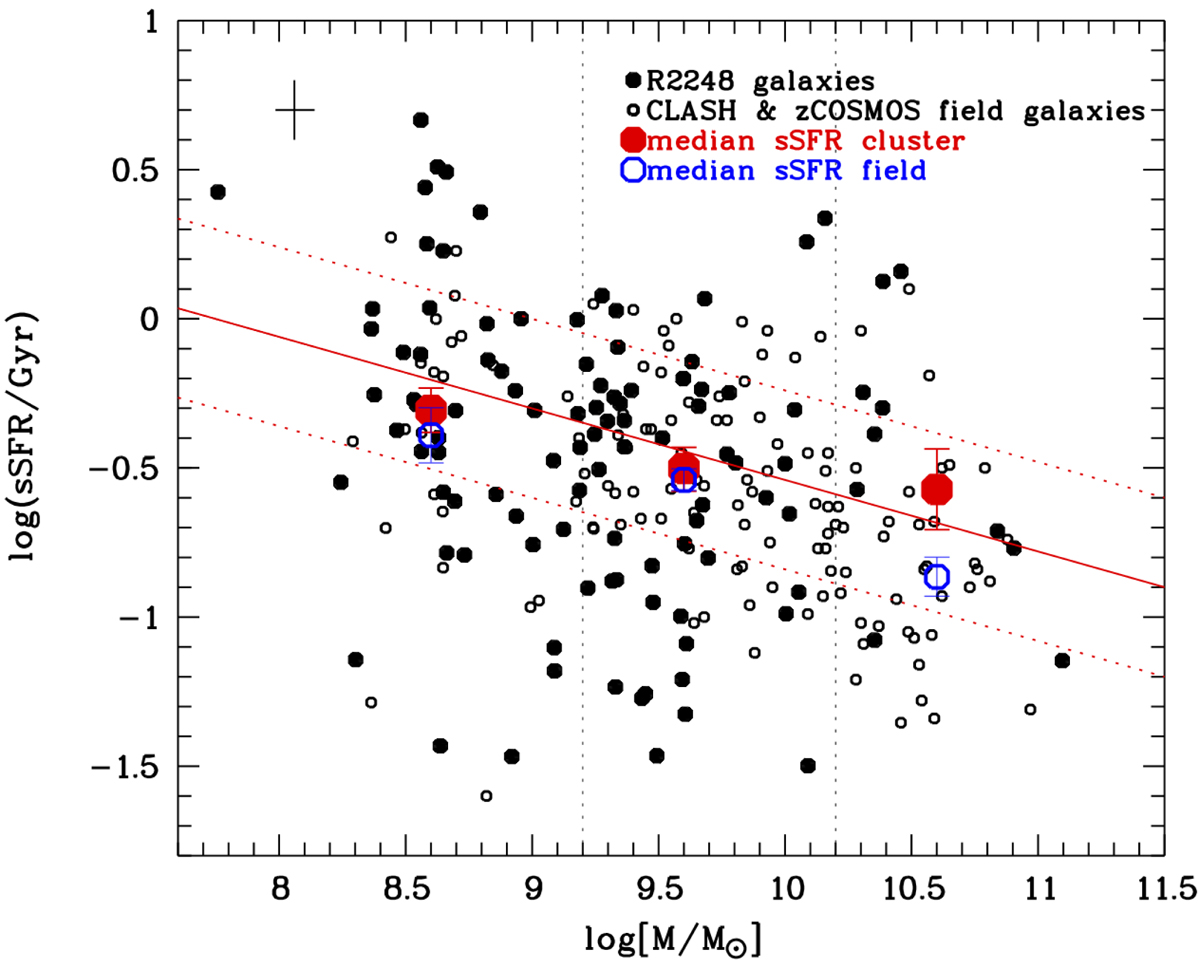
sSFR–M relation for the R2248 cluster members (filled circles) and for the comparison sample of CLASH and zCOSMOS field galaxies (open circles) with available measurements of the Hα emission line. Both f = 1 and f = 2 galaxies are considered. The median values of the sSFRs of cluster galaxies are plotted as the red symbols, while the blue, open symbols represent the median values of the sSFR of the field galaxies. The median sSFR values were computed for the three different mass bins, which are represented by the vertical dashed lines. The red solid line stands for the the main sequence of SF galaxies for a redshift of z ∼ 0.4, as derived by Peng et al. (2010). The dashed red lines encompasses the 0.3 dex dispersion of the MS. The black cross in the upper left corner shows the mean error of the sSFR and mass estimation. In this study, the “mass complete” sample is represented by the intermediate bin (9.2 < log(M/M⊙) < 10.2). In this mass bin, the median sSFR values of both cluster and field galaxies are comparable given the errors.
Current usage metrics show cumulative count of Article Views (full-text article views including HTML views, PDF and ePub downloads, according to the available data) and Abstracts Views on Vision4Press platform.
Data correspond to usage on the plateform after 2015. The current usage metrics is available 48-96 hours after online publication and is updated daily on week days.
Initial download of the metrics may take a while.