Fig. 2.
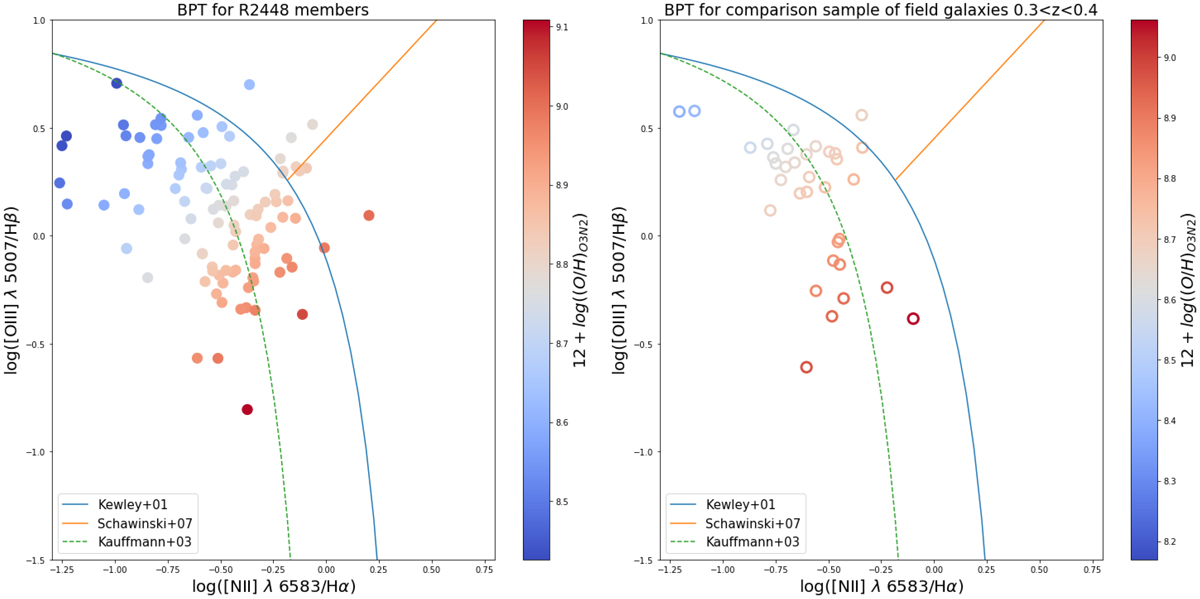
BPT (Baldwin et al. 2013) diagram for the R2248 cluster members (left) and comparison sample of CLASH field galaxies with 0.3 < z < 0.4 (right). This diagnostic diagram is used to distinguish whether the dominant source of ionisation comes from the stellar component or is rather associated with an AGN. The solid blue curve represents the theoretical curve of Kewley et al. (2001) and the green dashed one represents the empirical curve of Kauffmann et al. (2003a), which separate SF galaxies (below and left of the curves) from AGNs (above and right of the curves). The orange solid curve was derived by Schawinski & Thomas (2007) as the separation between Seyfert II galaxies (above and to the left) and LINERs (below and to the right). The colour bar shows the oxygen abundances of the investigated galaxies, as computed through the O3N2 method of Kewley et al. (2013). All CLASH galaxies classified as AGNs or LINERs were excluded from the sample.
Current usage metrics show cumulative count of Article Views (full-text article views including HTML views, PDF and ePub downloads, according to the available data) and Abstracts Views on Vision4Press platform.
Data correspond to usage on the plateform after 2015. The current usage metrics is available 48-96 hours after online publication and is updated daily on week days.
Initial download of the metrics may take a while.