Fig. 1.
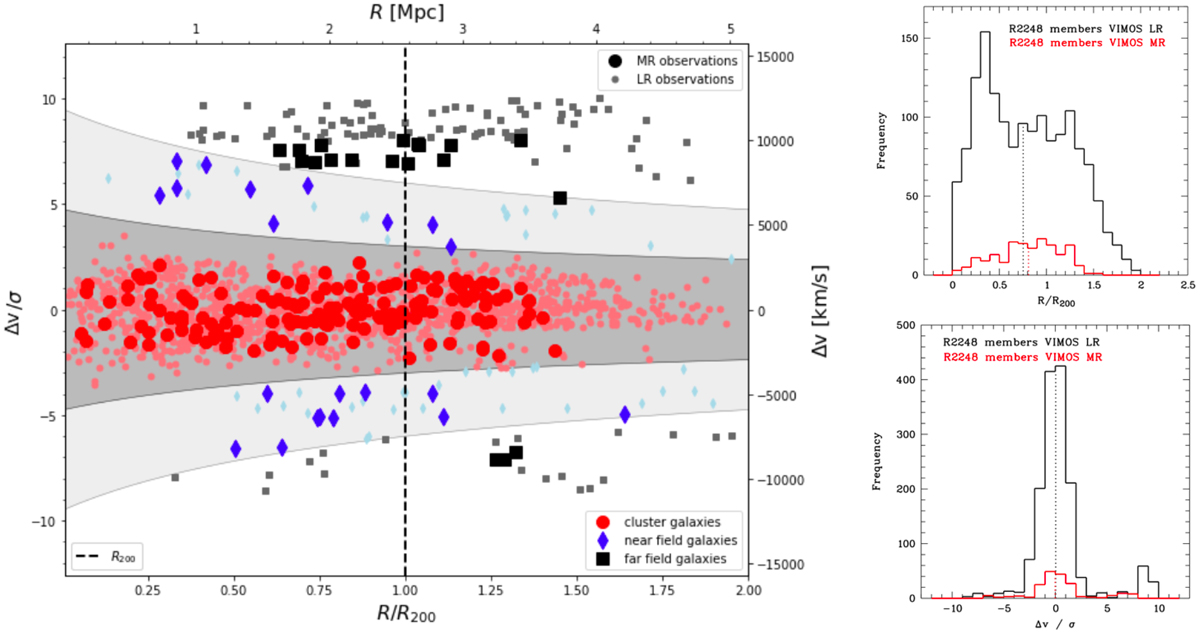
Left: clustercentric radius vs. line-of-sight velocity for the sample of CLASH galaxies with 0.3 < z < 0.4. Both galaxies with middle-resolution and low-resolution observations are shown. The red points which fall within the 3σ contours of the trumpet-shaped caustic profile (dark-grey area) are classified as R2248 cluster galaxies. The blue diamonds located between 3σ and 6σ (light-grey area) contours are considered to be galaxies from the near field, whereas the black squares located beyond the 6σ contours of the caustic are classified as far-field galaxies. Only the red symbols are considered for the computation of the cluster specific parameters such as R200 and M200. The dashed black line shows R200. The large symbols represent the galaxies with middle-resolution observations while the small ones represent the galaxies observed with a low-resolution grism, for which no flux measurements of ELs other than [OII] are available. Right-top: histogram showing the clustercentric radius normalised to R200 for the R2248 cluster members with low-resolution observations (black) and middle-resolution observations (red). The dotted lines show the median value for ![]() of both samples, colour coded accordingly. Right-bottom: histogram showing Δv normalised to the clusters velocity dispersion σ for the R2248 cluster members with low-resolution observations (black) and middle-resolution observations (red). The dotted lines represent the median values for
of both samples, colour coded accordingly. Right-bottom: histogram showing Δv normalised to the clusters velocity dispersion σ for the R2248 cluster members with low-resolution observations (black) and middle-resolution observations (red). The dotted lines represent the median values for ![]() of both samples, colour coded accordingly.
of both samples, colour coded accordingly.
Current usage metrics show cumulative count of Article Views (full-text article views including HTML views, PDF and ePub downloads, according to the available data) and Abstracts Views on Vision4Press platform.
Data correspond to usage on the plateform after 2015. The current usage metrics is available 48-96 hours after online publication and is updated daily on week days.
Initial download of the metrics may take a while.