Fig. B.1
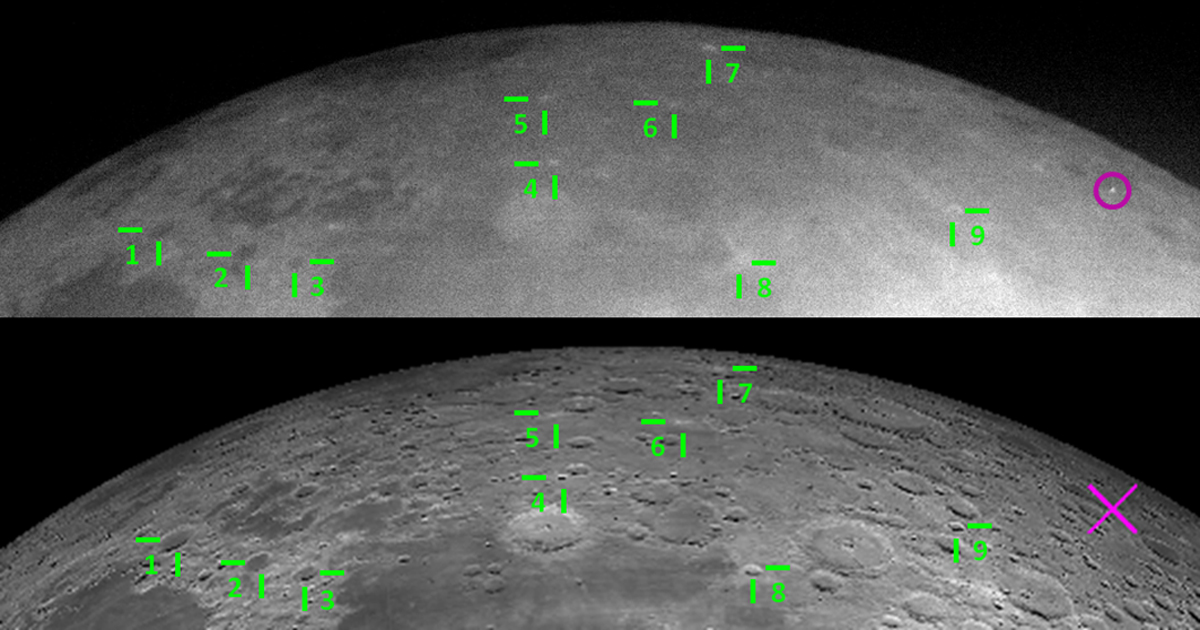
Example of the implementation of the localization tool of NELIOTA-DET. Upper figure: high-contrast image (NELIOTA data), while lower figure: high-resolution lunar map obtained from VMA6. Both figures are portion of the original ones. The paired lunar features are indicated as numbers. The detected flash is shown in the purple circle in the upper figure, while the purple “X” in the lower figure denotes its position. Subsequently, the lower image can be cross matched with the interactive image of VMA6 to obtain the selenographic coordinates of the flash.
Current usage metrics show cumulative count of Article Views (full-text article views including HTML views, PDF and ePub downloads, according to the available data) and Abstracts Views on Vision4Press platform.
Data correspond to usage on the plateform after 2015. The current usage metrics is available 48-96 hours after online publication and is updated daily on week days.
Initial download of the metrics may take a while.