Free Access
Fig. 3
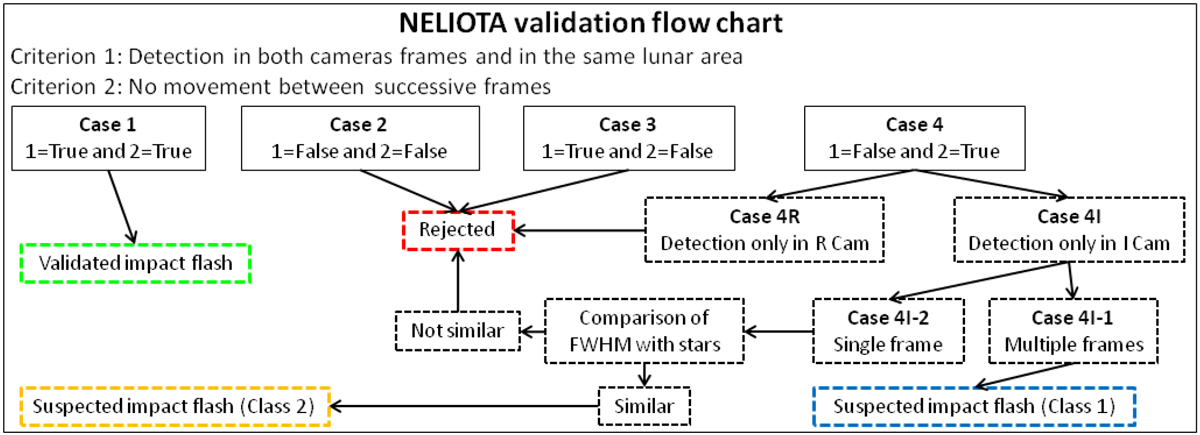
Validation flow chart for the events detected by NELIOTA-DET as implemented by the expert user. The criteria are noted on the upper part and all the possible characterizations of the events are given in colored-edge text boxes.
Current usage metrics show cumulative count of Article Views (full-text article views including HTML views, PDF and ePub downloads, according to the available data) and Abstracts Views on Vision4Press platform.
Data correspond to usage on the plateform after 2015. The current usage metrics is available 48-96 hours after online publication and is updated daily on week days.
Initial download of the metrics may take a while.