Fig. 27
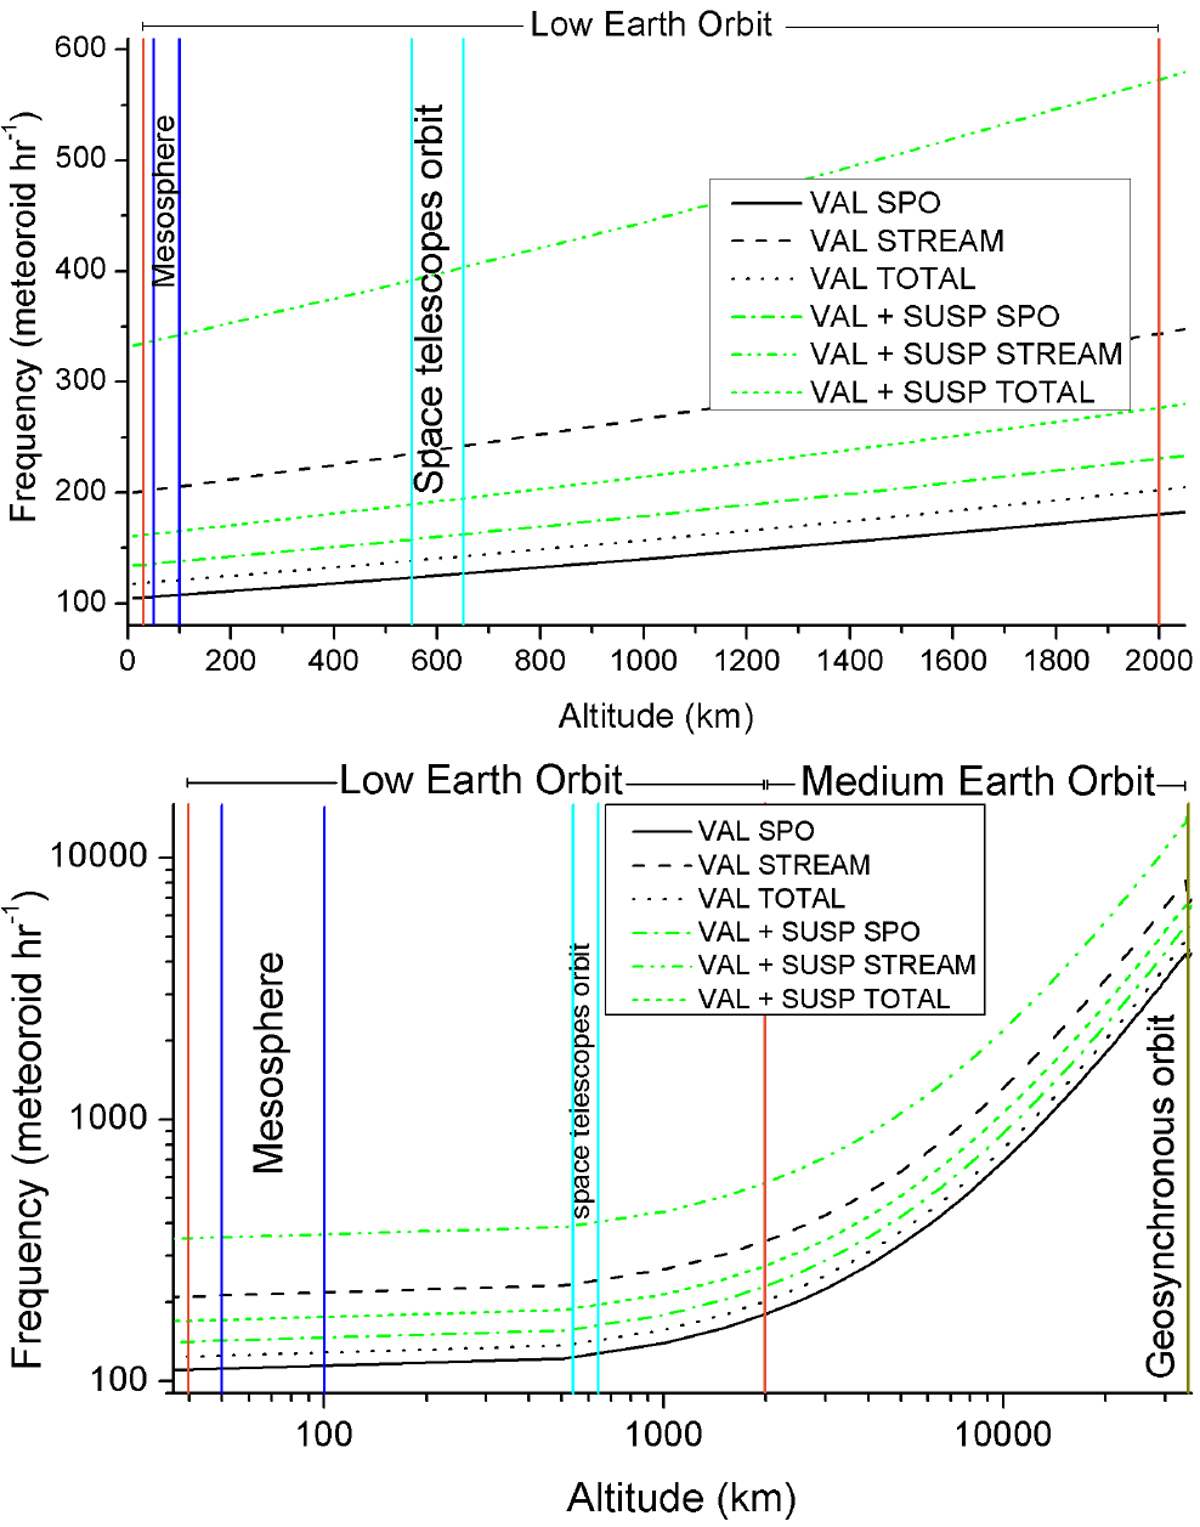
Frequency distributions of meteoroids in the vicinity of Earth based on the NELIOTA detection rate of lunar impact flashes. Upper panel: frequency distributions for the first 2000 km above the surface of Earth, while lower panel: extends up to 36 000 km. Black lines denote the calculated frequencies taking into account only the validated flashes, while green lines the respective frequencies based on the sum of validated and suspected flashes. Different styles of lines (e.g., solid, dashed, dotted) represent the frequencies of sporadic, stream, and total meteoroids according to the sample used (validated or validated and suspected flashes). Vertical solid lines indicate the boundaries of the low, medium and geosynchronous Earth orbits, space telescope orbits, and mesosphere.
Current usage metrics show cumulative count of Article Views (full-text article views including HTML views, PDF and ePub downloads, according to the available data) and Abstracts Views on Vision4Press platform.
Data correspond to usage on the plateform after 2015. The current usage metrics is available 48-96 hours after online publication and is updated daily on week days.
Initial download of the metrics may take a while.