Fig. 23
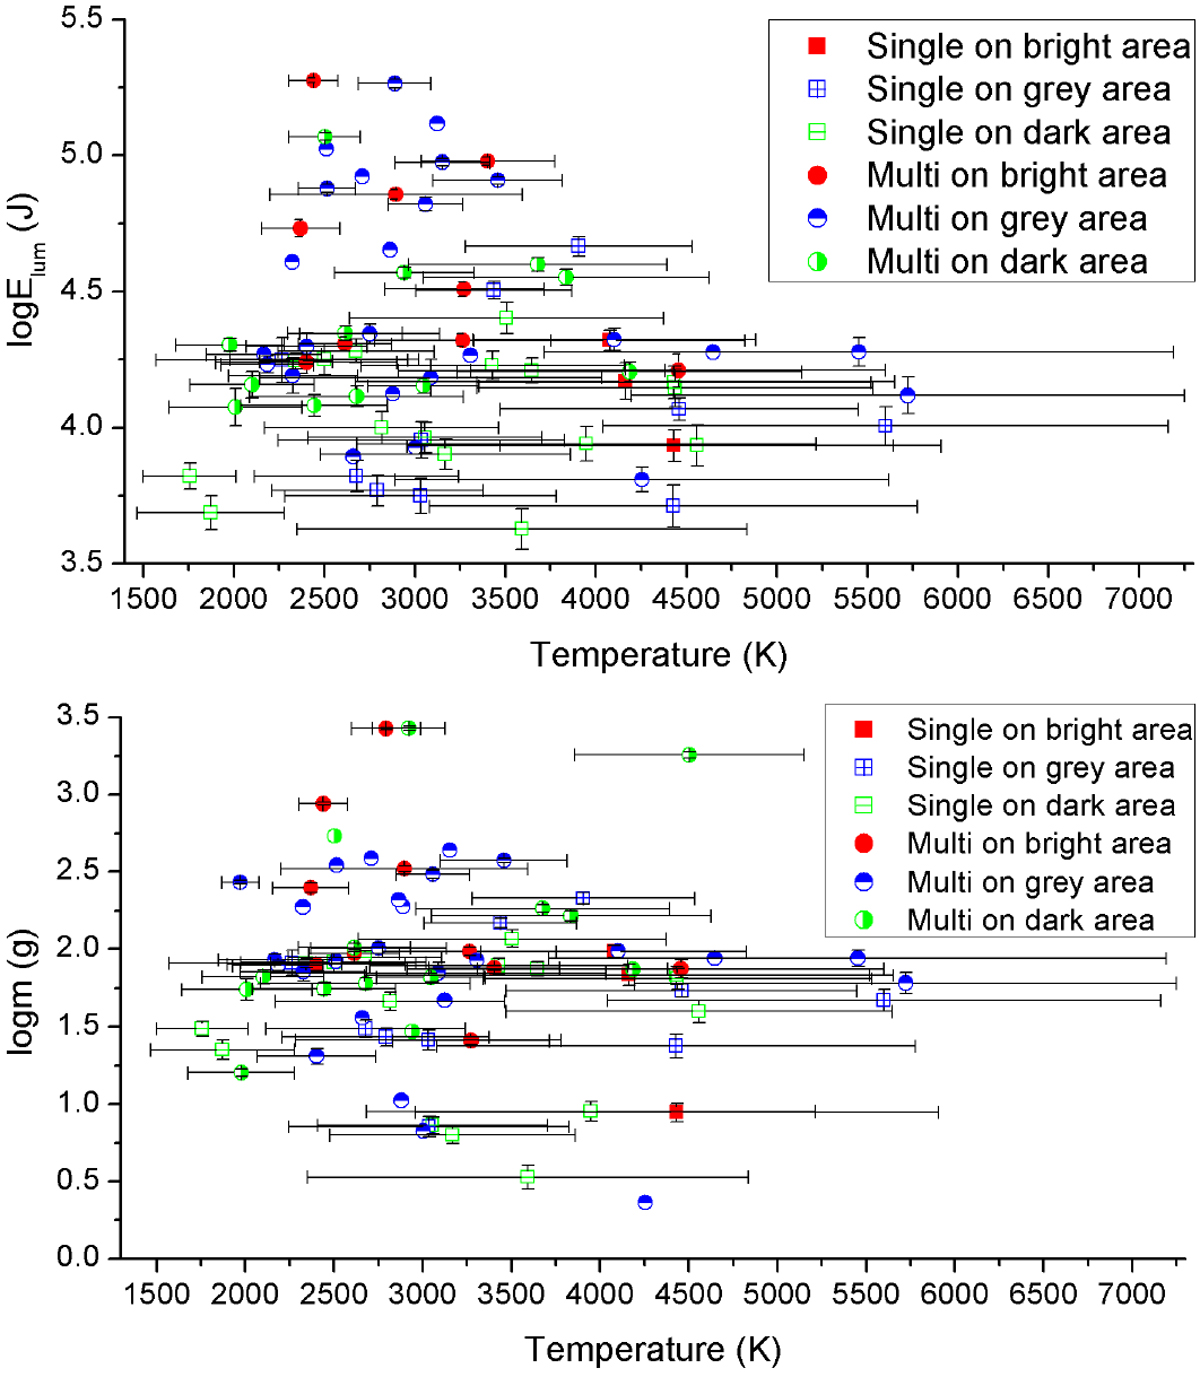
Correlation between the peak temperatures of the validated flashes against their respective Elum (upper panel) and against the mp of the respective meteoroids (lower panel) for η = 1.5 × 10⁻³. Squares denote the single frame flashes, while circles the multi-frames. Red, blue, and green colors denote that the flashes were detected in bright, grey, and dark lunar areas, respectively.
Current usage metrics show cumulative count of Article Views (full-text article views including HTML views, PDF and ePub downloads, according to the available data) and Abstracts Views on Vision4Press platform.
Data correspond to usage on the plateform after 2015. The current usage metrics is available 48-96 hours after online publication and is updated daily on week days.
Initial download of the metrics may take a while.