Free Access
Fig. 21
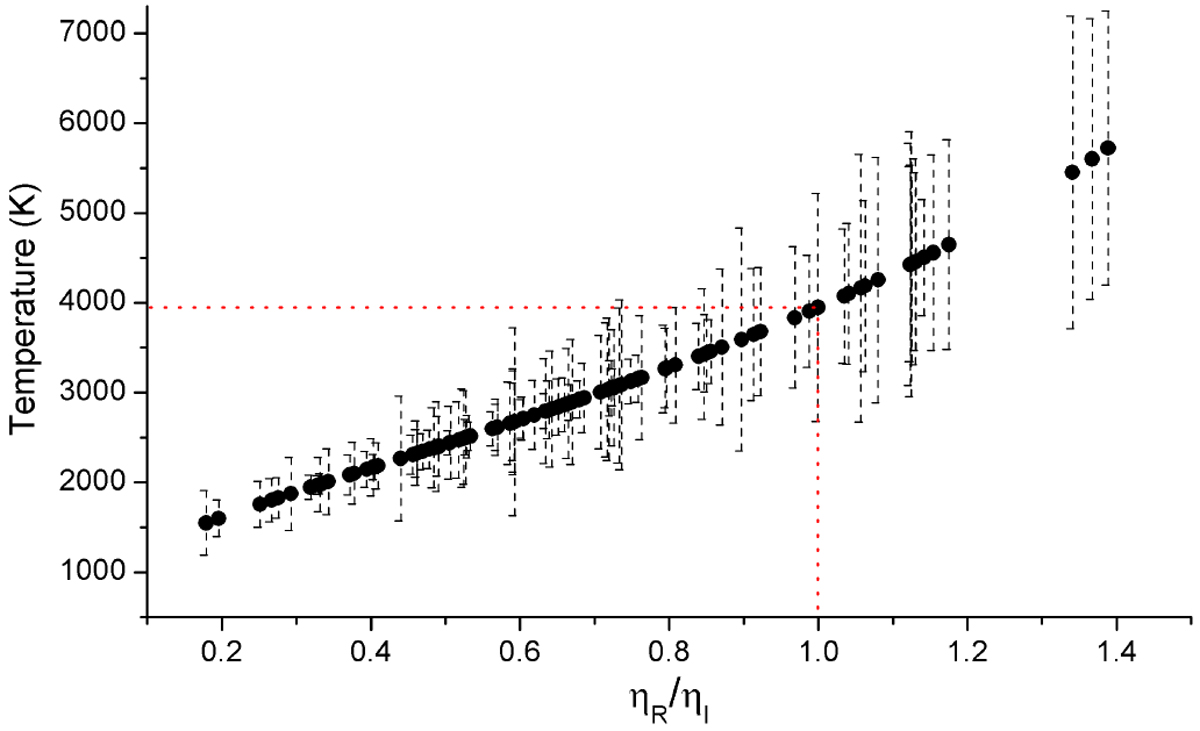
Correlation between peak temperature and luminous efficiency ratio for the validated flashes. The crossing of the red dashed lines indicates the temperature value of the flash for which the luminous efficiencies of R and I bands are equal.
Current usage metrics show cumulative count of Article Views (full-text article views including HTML views, PDF and ePub downloads, according to the available data) and Abstracts Views on Vision4Press platform.
Data correspond to usage on the plateform after 2015. The current usage metrics is available 48-96 hours after online publication and is updated daily on week days.
Initial download of the metrics may take a while.