Free Access
Fig. 13
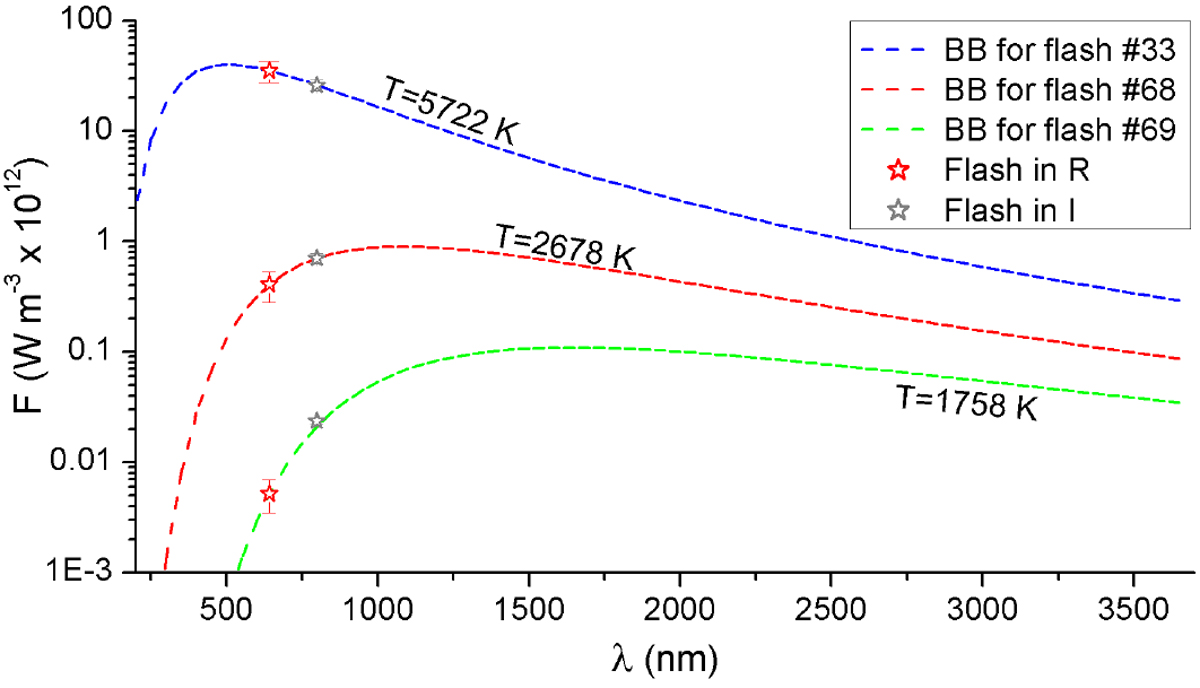
Examples of BB curve fit (dashed colored lines) for two extreme flash temperatures (5722 and 1758 K) and for a more typical one (2678 K). Stars (red = R and grey = I band) denote the energy flux per wavelength of the flashes in R and I passbands.
Current usage metrics show cumulative count of Article Views (full-text article views including HTML views, PDF and ePub downloads, according to the available data) and Abstracts Views on Vision4Press platform.
Data correspond to usage on the plateform after 2015. The current usage metrics is available 48-96 hours after online publication and is updated daily on week days.
Initial download of the metrics may take a while.