Fig. 4.
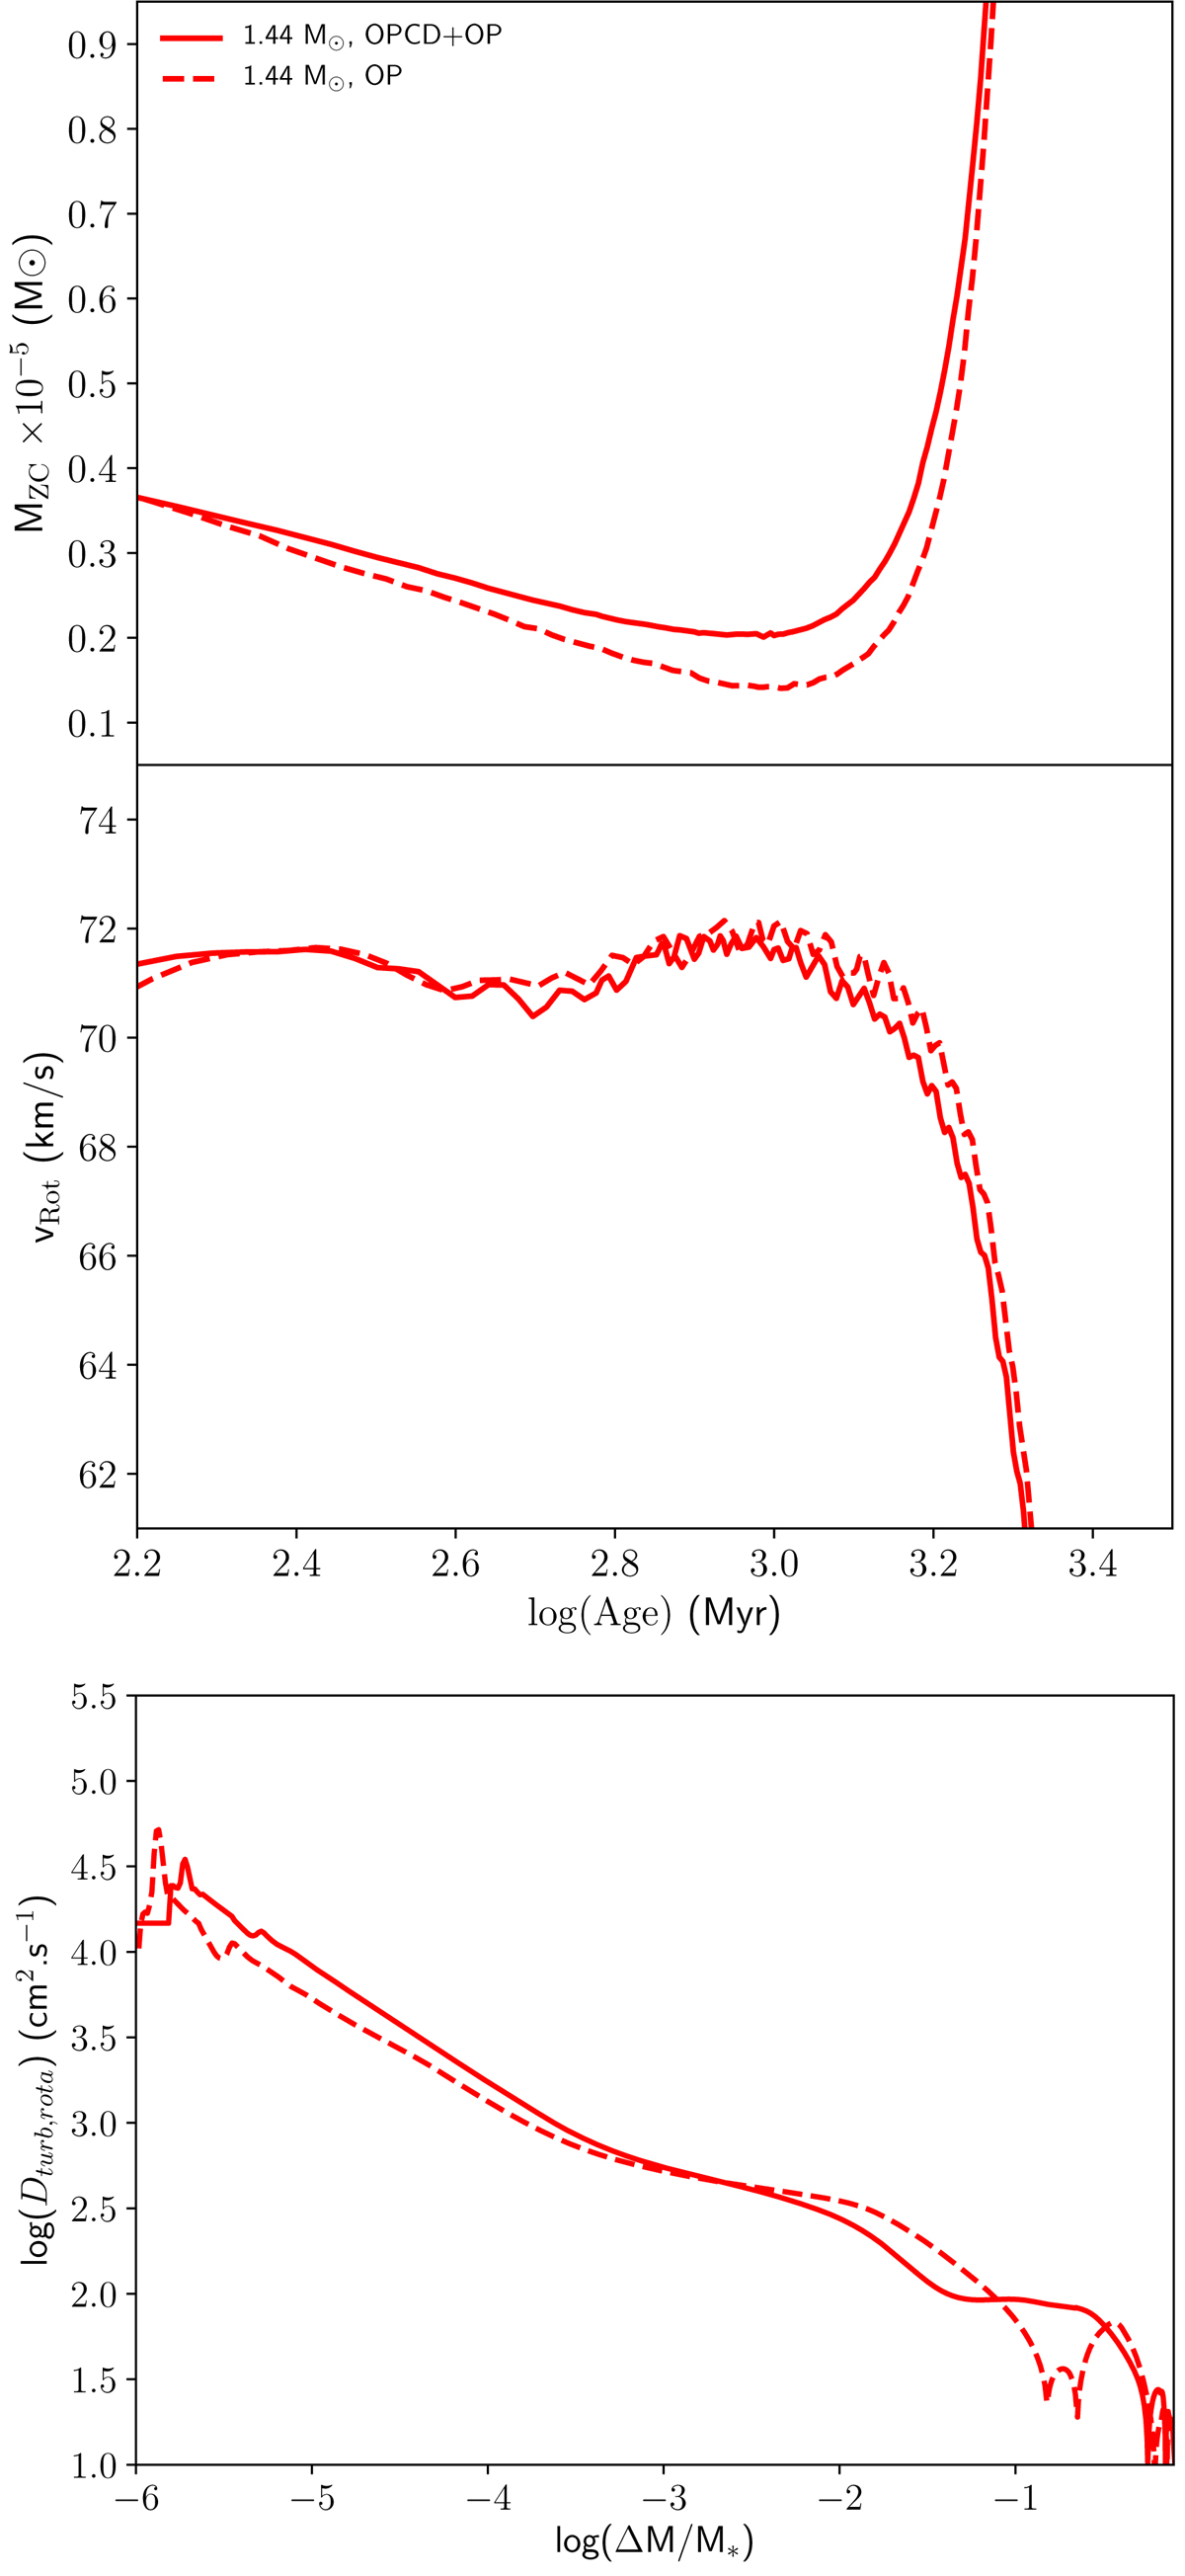
Evolution of the mass of the surface convective zone (top panel) and of the surface rotation speed (middle panel) of the 1.44 M⊙ models (C2 and C5). In model C5, the opacities are calculated from an OP opacity table assuming a fixed solar mixture of chemical elements (dashed curves), while in model C2 the opacities are calculated for the actual composition with the OPCD package. Lower panel: Dturb, rota profile for both models at 1 Gyr.
Current usage metrics show cumulative count of Article Views (full-text article views including HTML views, PDF and ePub downloads, according to the available data) and Abstracts Views on Vision4Press platform.
Data correspond to usage on the plateform after 2015. The current usage metrics is available 48-96 hours after online publication and is updated daily on week days.
Initial download of the metrics may take a while.