Fig. A.1.
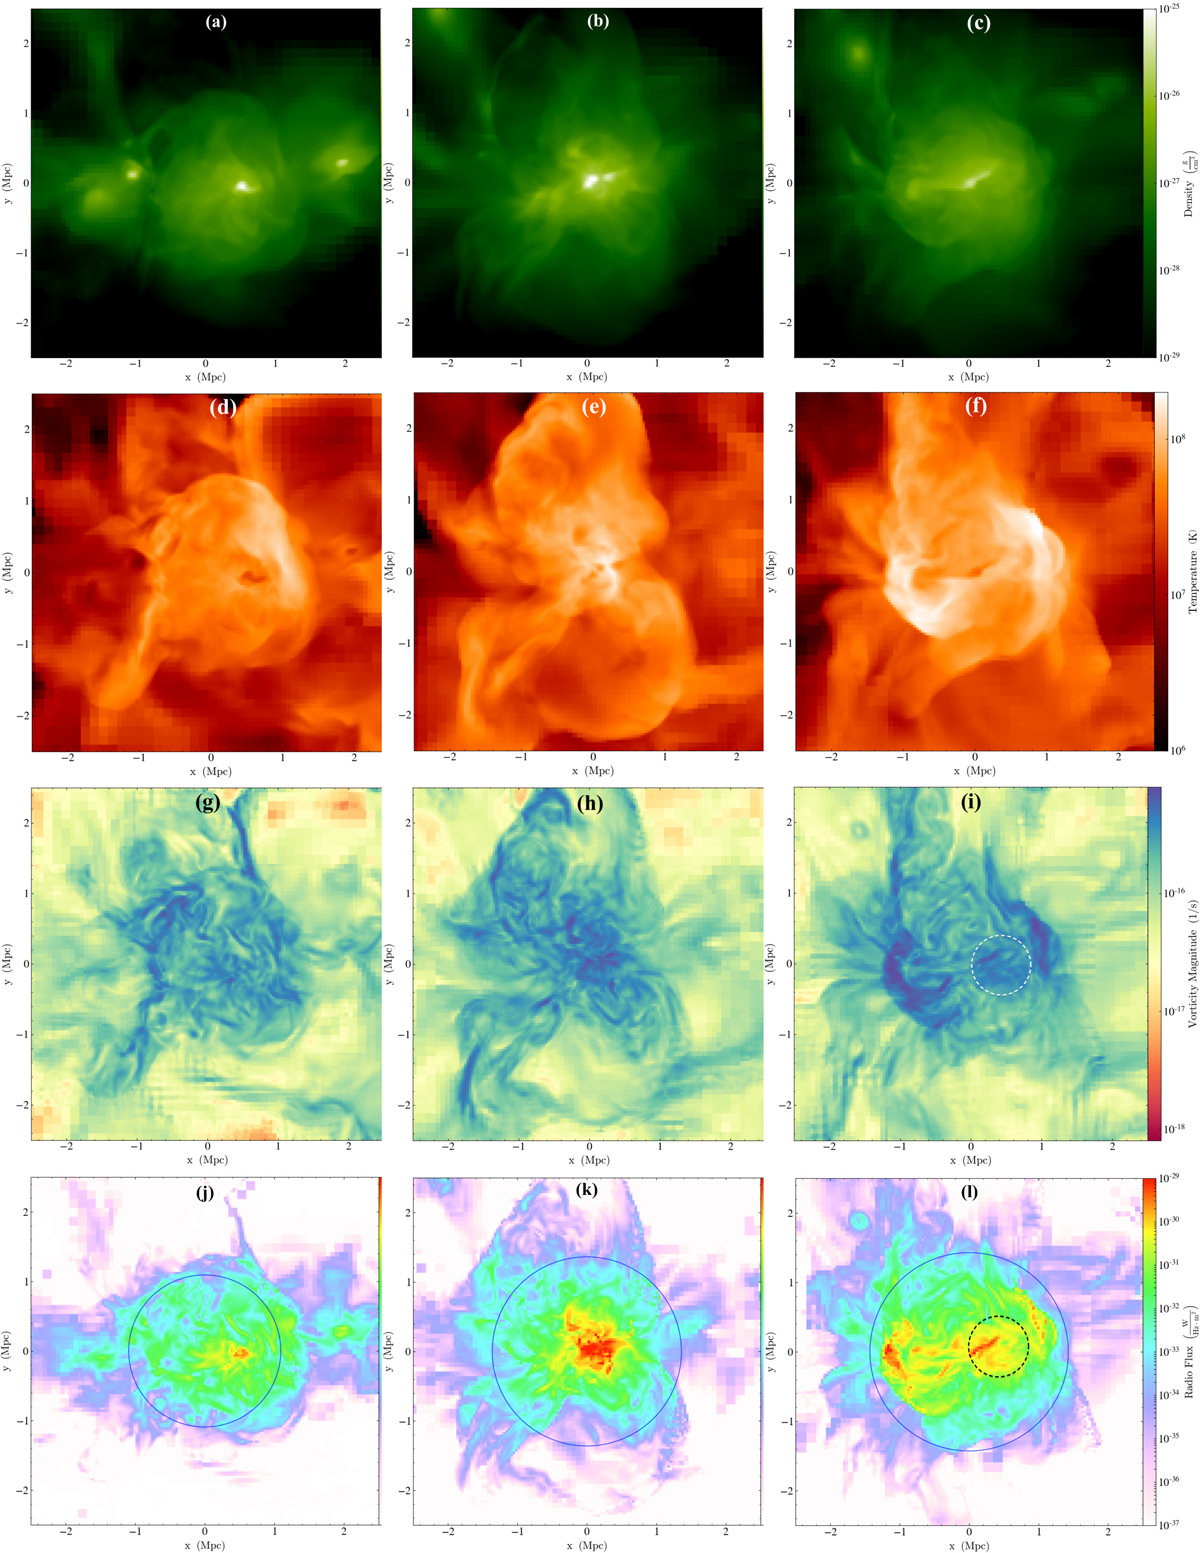
Each panel is a slice plot of a 5 × 5 Mpc2 area focused on a time series of a cluster merger event. Density (first row), temperature (second row), vorticity magnitude (third row) and radio emission maps of simulated cluster at a pre-merger (first column), merger (second column) and postmerger (third column) state. The white and black dashed circle in panels i and l respectively are wake turbulence and corresponding radio emission from TRA electrons.
Current usage metrics show cumulative count of Article Views (full-text article views including HTML views, PDF and ePub downloads, according to the available data) and Abstracts Views on Vision4Press platform.
Data correspond to usage on the plateform after 2015. The current usage metrics is available 48-96 hours after online publication and is updated daily on week days.
Initial download of the metrics may take a while.