Fig. 7.
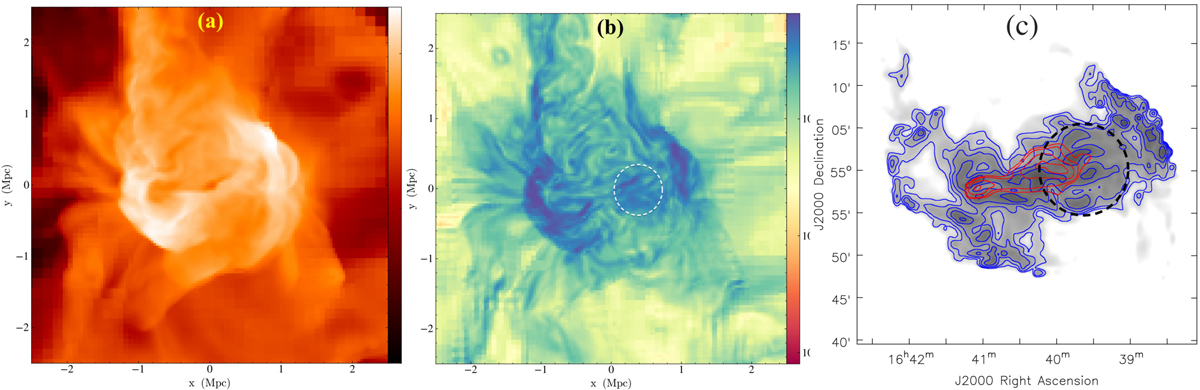
Panels a and b: respectively post-merger temperature shock and vorticity magnitude (![]() (representing turbulence) of a simulated cluster. Panel c: modelled mock radio map considering radio emission from both DSA and TRA electrons (see Appendix A.1) plotted as grey (zoomed on the cluster). The computed X-ray luminosity is overlaid in red contours. Co-ordinates shown are arbitrary.
(representing turbulence) of a simulated cluster. Panel c: modelled mock radio map considering radio emission from both DSA and TRA electrons (see Appendix A.1) plotted as grey (zoomed on the cluster). The computed X-ray luminosity is overlaid in red contours. Co-ordinates shown are arbitrary.
Current usage metrics show cumulative count of Article Views (full-text article views including HTML views, PDF and ePub downloads, according to the available data) and Abstracts Views on Vision4Press platform.
Data correspond to usage on the plateform after 2015. The current usage metrics is available 48-96 hours after online publication and is updated daily on week days.
Initial download of the metrics may take a while.