Fig. 5.
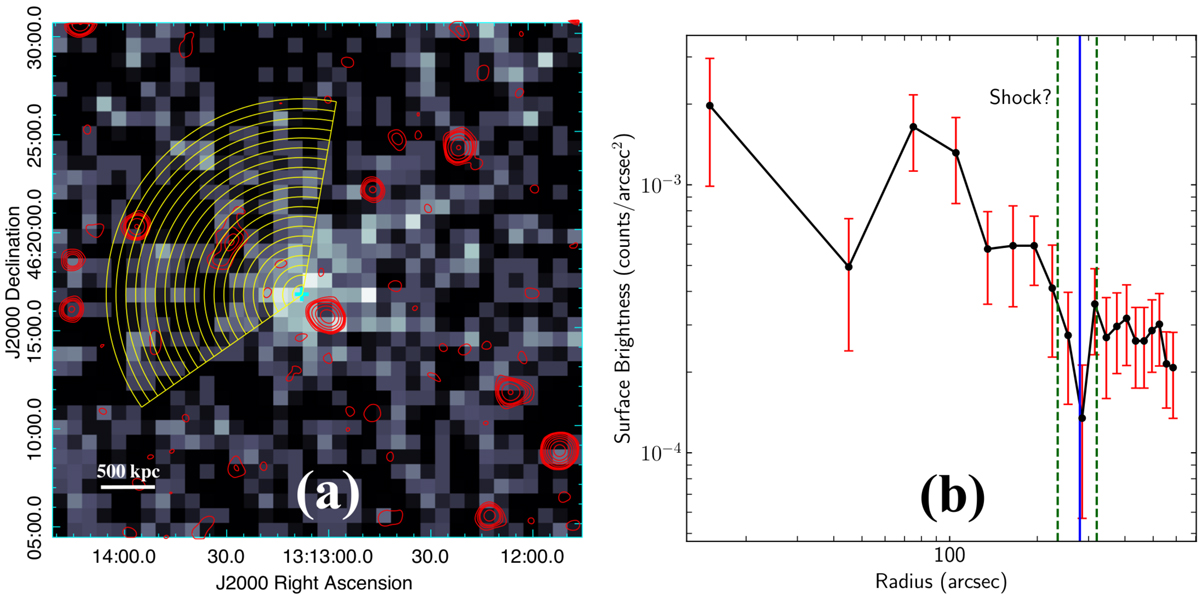
Panel a: sector for which radial profile of X-ray photon count (0.1–2.4 keV ROSAT survey data) is displayed in panel b. Panel b: photon count radial profile for the sector containing the radio relic shown in panel a and the cluster radio shock position (blue vertical line). Distance of the inner and the outer edge of the radio relic (from the X-ray peak) are indicated with dark green vertical dashed lines.
Current usage metrics show cumulative count of Article Views (full-text article views including HTML views, PDF and ePub downloads, according to the available data) and Abstracts Views on Vision4Press platform.
Data correspond to usage on the plateform after 2015. The current usage metrics is available 48-96 hours after online publication and is updated daily on week days.
Initial download of the metrics may take a while.