Fig. 1.
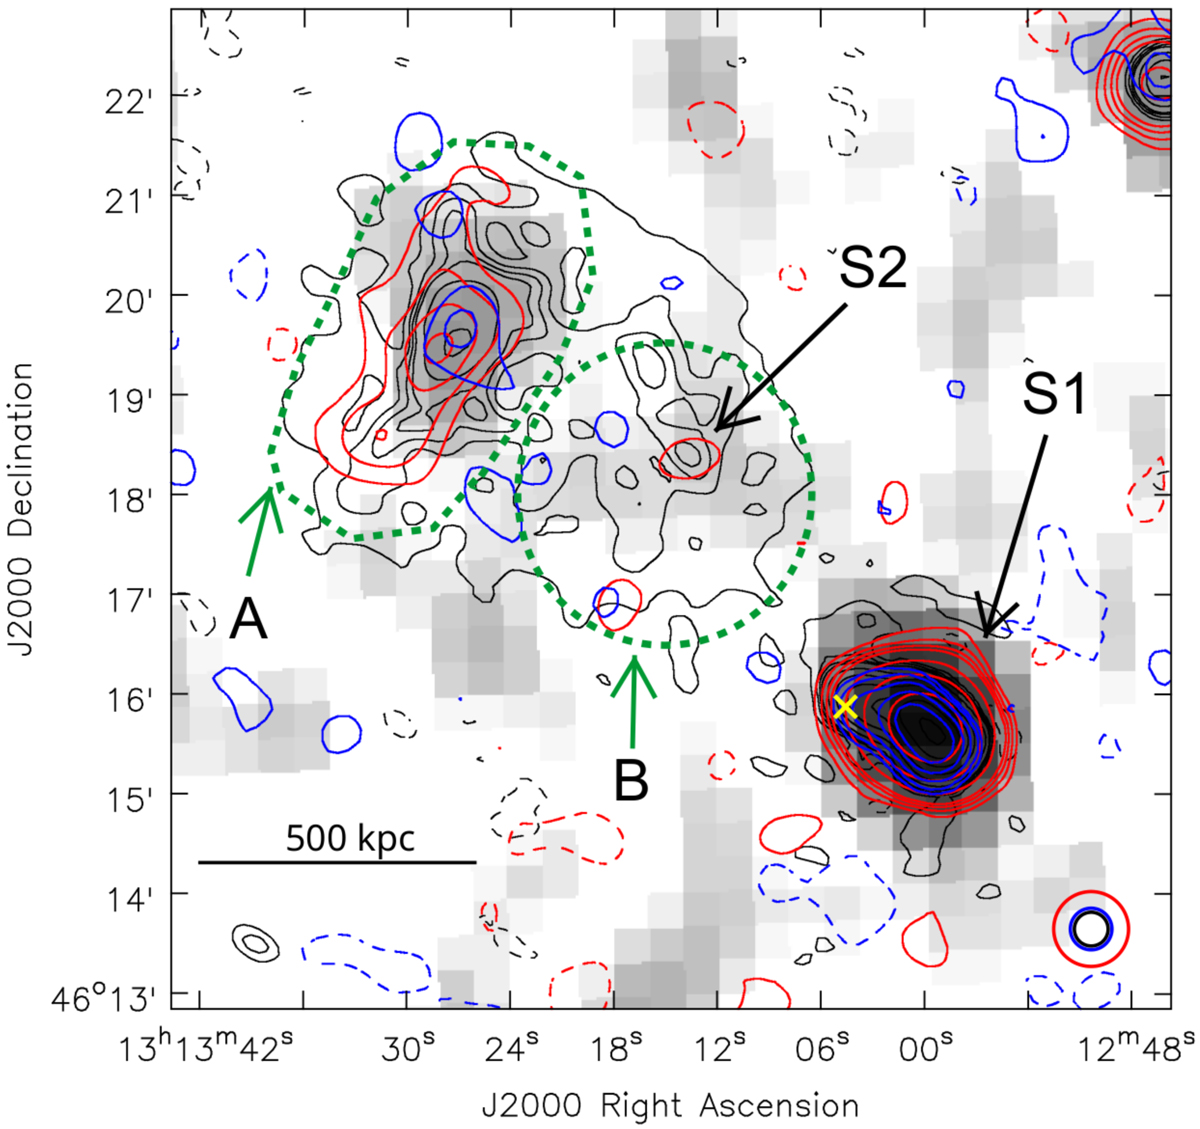
Contours of low resolution (20″ × 20″) LoTSS at 144 MHz (black), NVSS at 1.4 GHz (red) and TGSS at 150 MHz (blue) on WENSS (325 MHz) grey colour map. Contours are at −3, 5, 9, 13, 17, 34, 68, 136, 272, 544, 1088 × σ for LoTSS with σ = 150 μJy, NVSS at −3, 3, 5, 7, 9, 18, 36, 72, 144 × σ with σ = 350 μJy and TGSS at −3, 3, 5, 10, 20, 40, 80, 160 × σ with σ = 3 mJy. The relic and the trailing radio emission are highlighted by green dashed polygon (“A”) and a circle (“B”), respectively. “S1” and “S2” are two point-like radio sources inside the cluster. The Abell cluster centre is marked as a yellow cross.
Current usage metrics show cumulative count of Article Views (full-text article views including HTML views, PDF and ePub downloads, according to the available data) and Abstracts Views on Vision4Press platform.
Data correspond to usage on the plateform after 2015. The current usage metrics is available 48-96 hours after online publication and is updated daily on week days.
Initial download of the metrics may take a while.