Fig. 9.
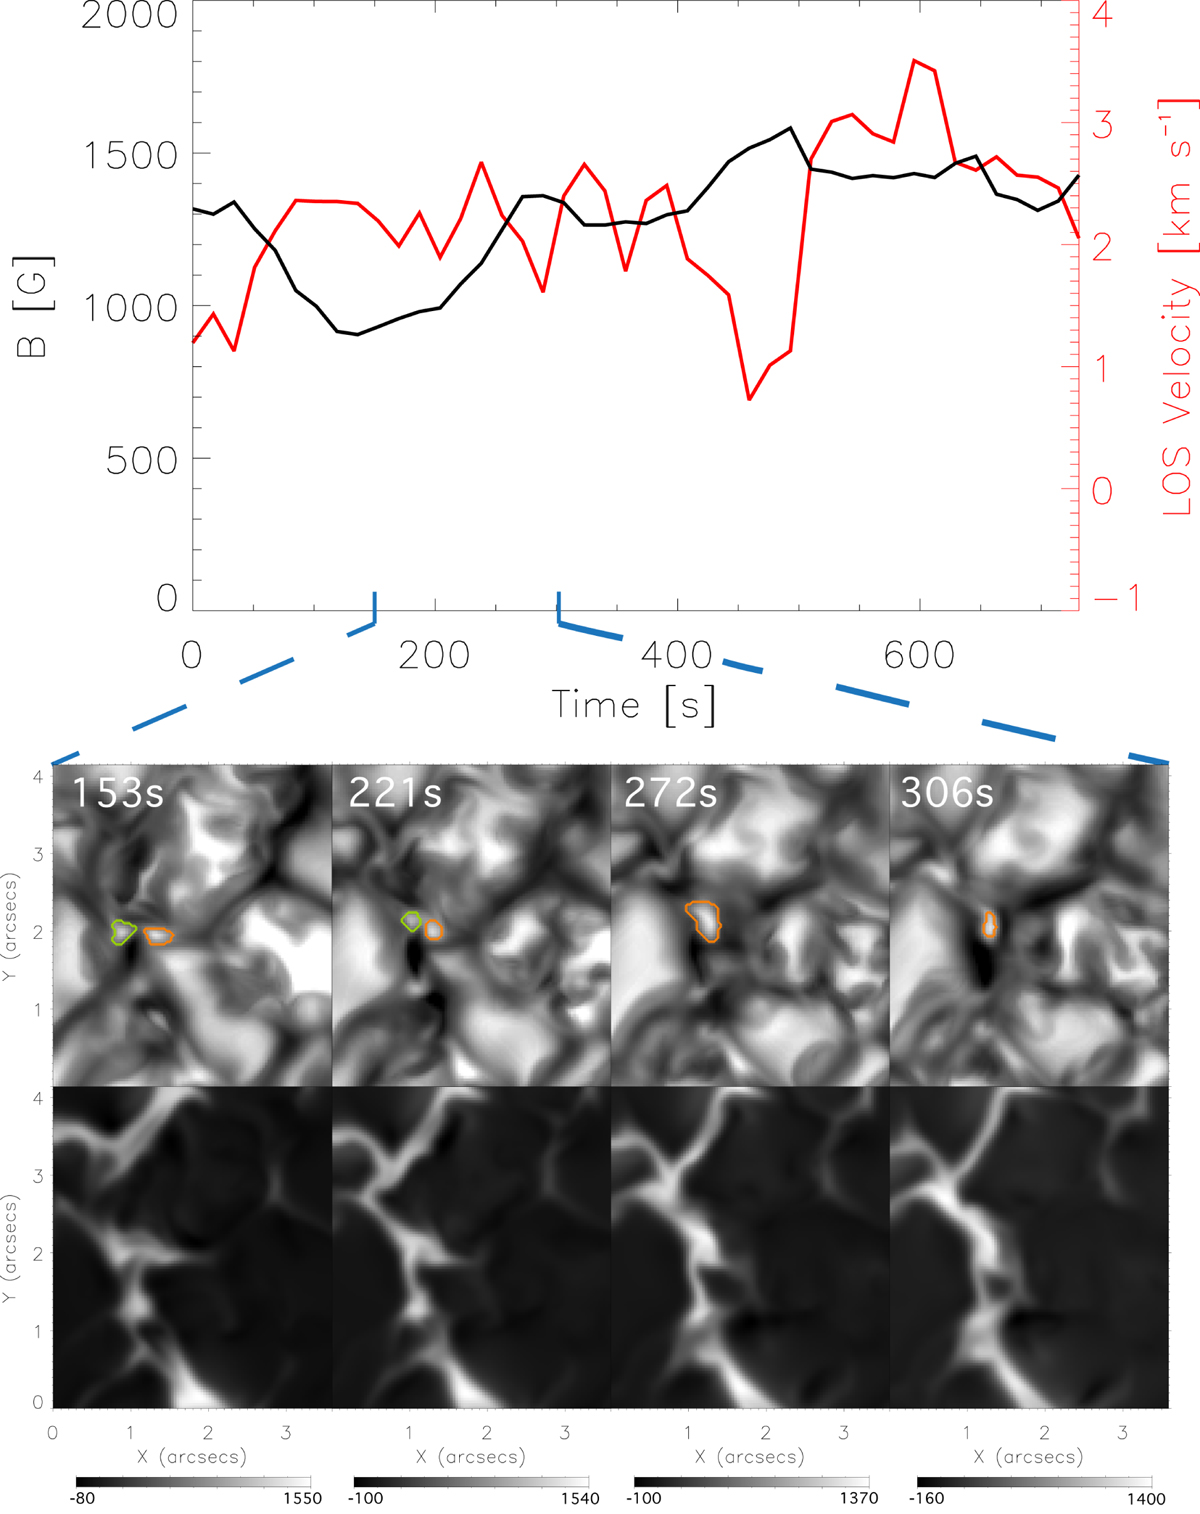
Example of merging MBPs from the MURaM simulations leading to magnetic field amplification. The black line shows the magnetic field in the vertical direction while the red line indicates the LOS velocity. The panels below show the evolution of the MBP in the intensity images (top) and the evolution of the magnetic field for the corresponding intensity images, for the time period indicated by the blue dashed line. Two MBPs (orange and green contours) can be seen around 1″ to 1.5″ in x and 2″ in y in the intensity images in the first frame. The two MBPs move towards each other before coalescing, with the LOS magnetic field rising and peaking as they merge. As before, the magnetic field and LOS velocity plots above represent the evolution of the orange contoured MBP.
Current usage metrics show cumulative count of Article Views (full-text article views including HTML views, PDF and ePub downloads, according to the available data) and Abstracts Views on Vision4Press platform.
Data correspond to usage on the plateform after 2015. The current usage metrics is available 48-96 hours after online publication and is updated daily on week days.
Initial download of the metrics may take a while.