Fig. 8.
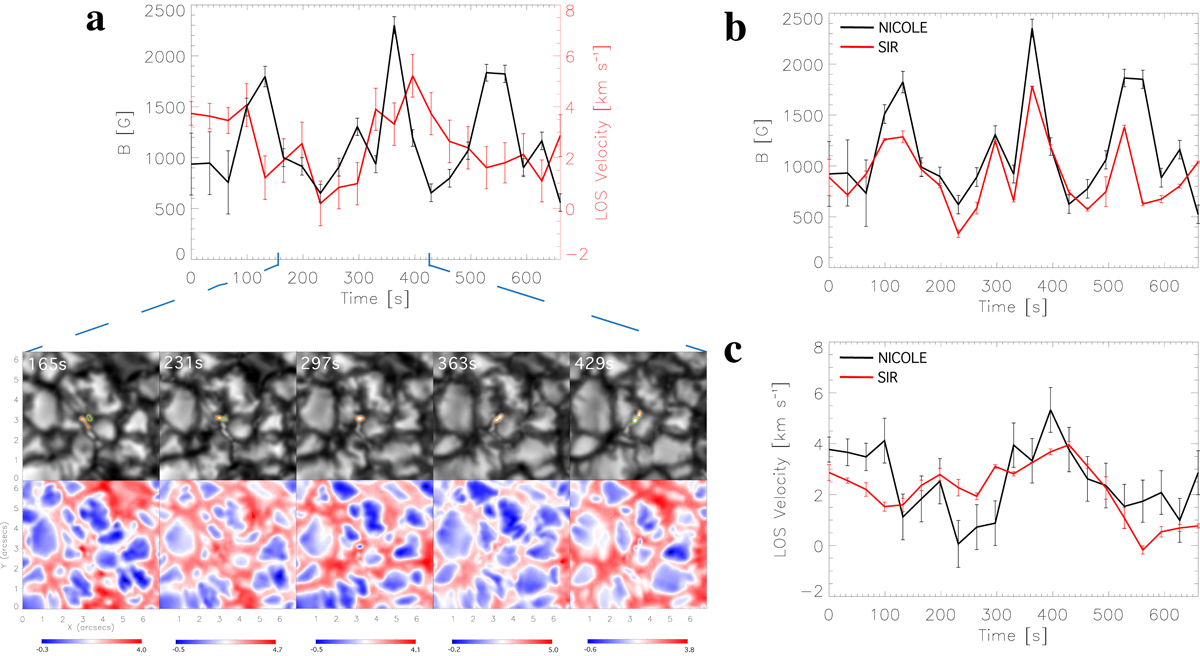
Same plots as Fig. 6, but for observations of merging MBPs leading to magnetic field amplification. The temporal evolution of the magnetic field shows how complicated MBP evolution is due to various factors. The intensity images in panel a help demonstrate this complex behaviour. Orange contours in the intensity images show the MBP, as tracked by our algorithm, used to make the evolution plots above. Green contours indicate the other MBP involved in the merger. The first small peak in magnetic field (at ∼1300 G) is due to a merging of two MBPs. The intensity images show the motion of several MBPs within a small group. One MBP (orange contours) is pushed by the granules past the small group, before being forced back and eventually merging with another MBP (green contour). The merger results in a peak in the LOS magnetic field. The granules continue to buffet the newly merged MBP compressing it, and resulting in the secondary peak a couple of seconds after the merger peak. The comparison between NICOLE and SIR in panels b and c confirm the amplification due to these processes.
Current usage metrics show cumulative count of Article Views (full-text article views including HTML views, PDF and ePub downloads, according to the available data) and Abstracts Views on Vision4Press platform.
Data correspond to usage on the plateform after 2015. The current usage metrics is available 48-96 hours after online publication and is updated daily on week days.
Initial download of the metrics may take a while.