Fig. 6.
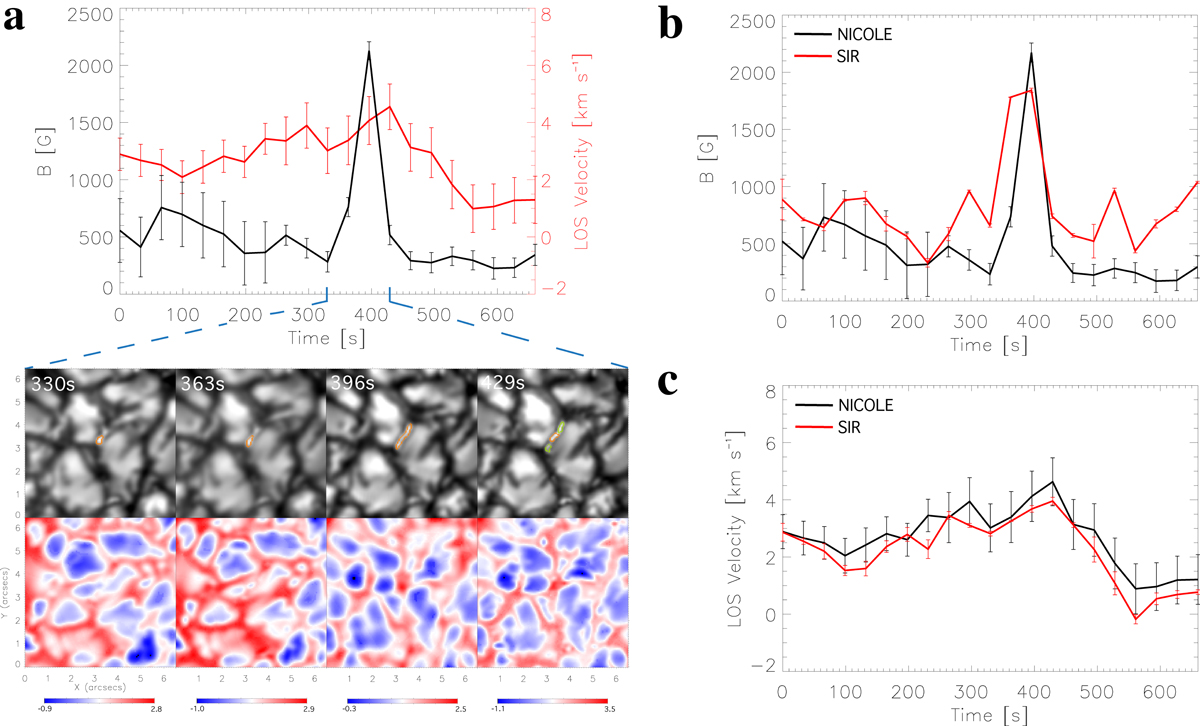
Example from our observations of granular compression leading to magnetic field amplification in an MBP. Panel a: temporal evolution of the MBP, with the plots at the top showing the output of the NICOLE inversions, with the black line indicating the LOS magnetic field and the red line the evolution of the LOS velocity. The images below this plot show the evolution of the MBP during the amplification phase indicated by the blue dashed lines. Orange contours in the intensity images show the MBP, as tracked by our algorithm, used to make the evolution plots above. Green contours in the final panel show the MBPs that split from the main MBP under investigation after the MBP is compressed and stretched out. LCT analysis of the granular flow direction show that the granules expand towards the MBP, resulting in its compression and the amplification of the magnetic field. The LOS velocity peaks after the magnetic field peak, contrary to the standard convective collapse process. Panels b and c: comparisons between the temporal evolution of the LOS magnetic field and LOS velocity, respectively, as derived from the NICOLE (black) and SIR (red) inversions. The two methods show consistent results.
Current usage metrics show cumulative count of Article Views (full-text article views including HTML views, PDF and ePub downloads, according to the available data) and Abstracts Views on Vision4Press platform.
Data correspond to usage on the plateform after 2015. The current usage metrics is available 48-96 hours after online publication and is updated daily on week days.
Initial download of the metrics may take a while.