Fig. 3.
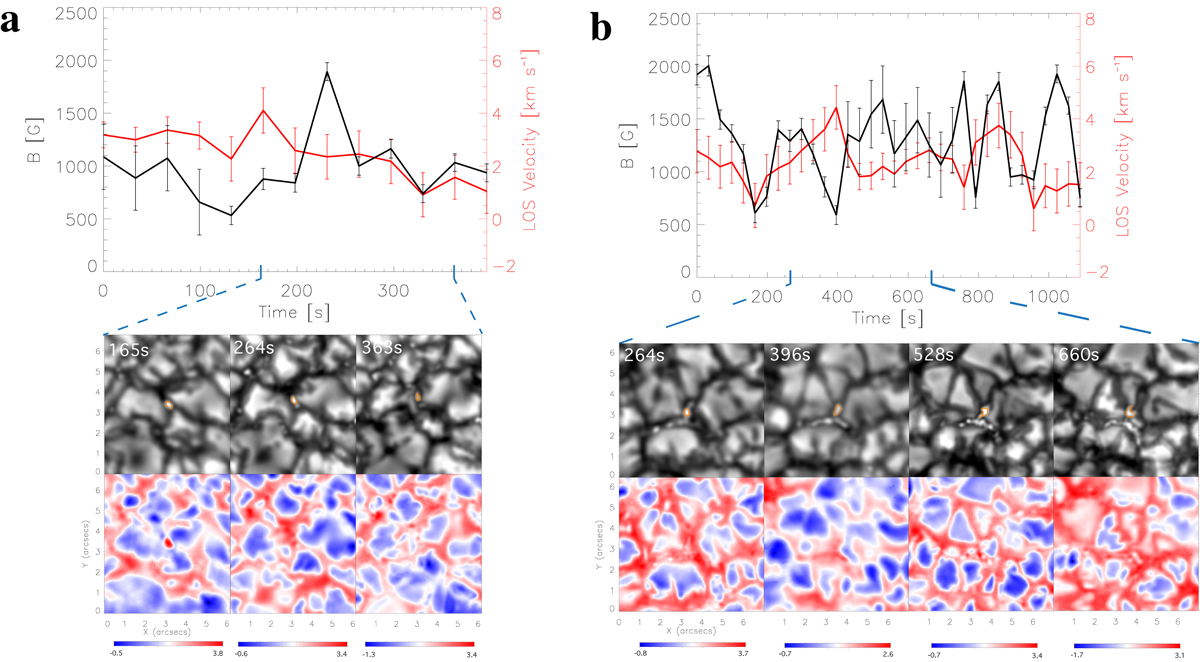
Examples of the temporal evolution of MBPs undergoing convective collapse. Within the plots, the black line indicates the LOS magnetic field strength, while the red line indicates the LOS velocity in each frame that the MBP was detected. The values were obtained from NICOLE inversions. The calculation of error bars follows Reid et al. (2016). In each panel, below the temporal evolution plot, we show intensity images (taken at 6301.0392 Å in our CRISP line scans) and LOS velocity maps (from NICOLE inversions) for the MBP at key stages in its evolution. Blue dashed lines indicate the time interval which these images are taken. Orange contours in the intensity images show the MBP, as tracked by our algorithm, used to make the evolution plots above. Panel a: simple convective collapse case study. Here the LOS velocity within the MBP increases just prior to the amplification of the magnetic. The intensity images show the MBP getting smaller and brighter during this process. Panel b: case for multiple collapse events within an MBPs lifetime. This plot shows the complexity of MBP evolution, with collapse events occurring at multiple times in the MBP’s lifetime. More details on both these MBPs can be found in the main text.
Current usage metrics show cumulative count of Article Views (full-text article views including HTML views, PDF and ePub downloads, according to the available data) and Abstracts Views on Vision4Press platform.
Data correspond to usage on the plateform after 2015. The current usage metrics is available 48-96 hours after online publication and is updated daily on week days.
Initial download of the metrics may take a while.