Fig. 1.
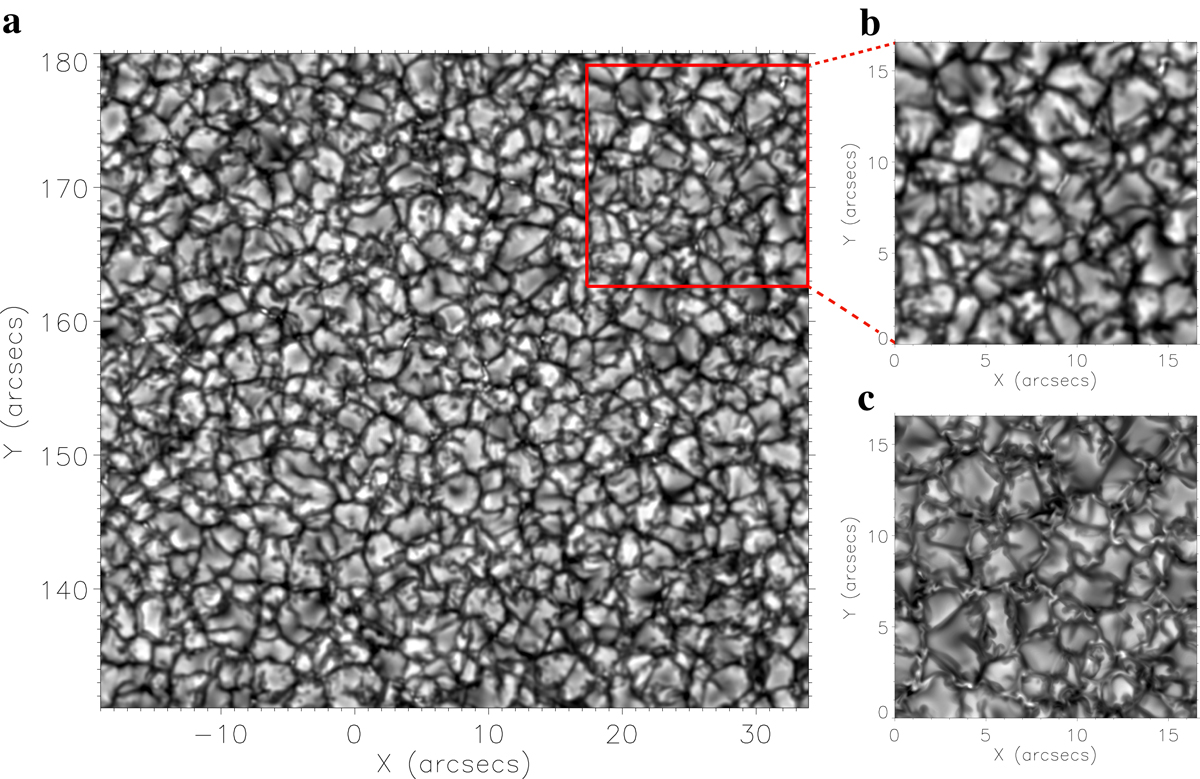
Panel a: full field-of-view of our data set as observed with CRISP at the SST on 2014 July 27th from around 14:18 UT until 15:11 UT in the 6301 Å and 6302 Å line pair with this image taken at 6301.0392 Å in the line scan. The target was the quiet Sun at disc centre. The red box in panel a shows the region used for the cut out displayed in panel b. Panel b: 16″ × 16″ region of the field-of-view. This cut out is shown as a direct comparison of the MURaM simulations presented in panel c, which have the same 16″ × 16″ spatial dimensions. These MURaM simulations have an initial 200 G field, and a spatial resolution of 25 km pixel−1.
Current usage metrics show cumulative count of Article Views (full-text article views including HTML views, PDF and ePub downloads, according to the available data) and Abstracts Views on Vision4Press platform.
Data correspond to usage on the plateform after 2015. The current usage metrics is available 48-96 hours after online publication and is updated daily on week days.
Initial download of the metrics may take a while.