Free Access
Fig. 10.
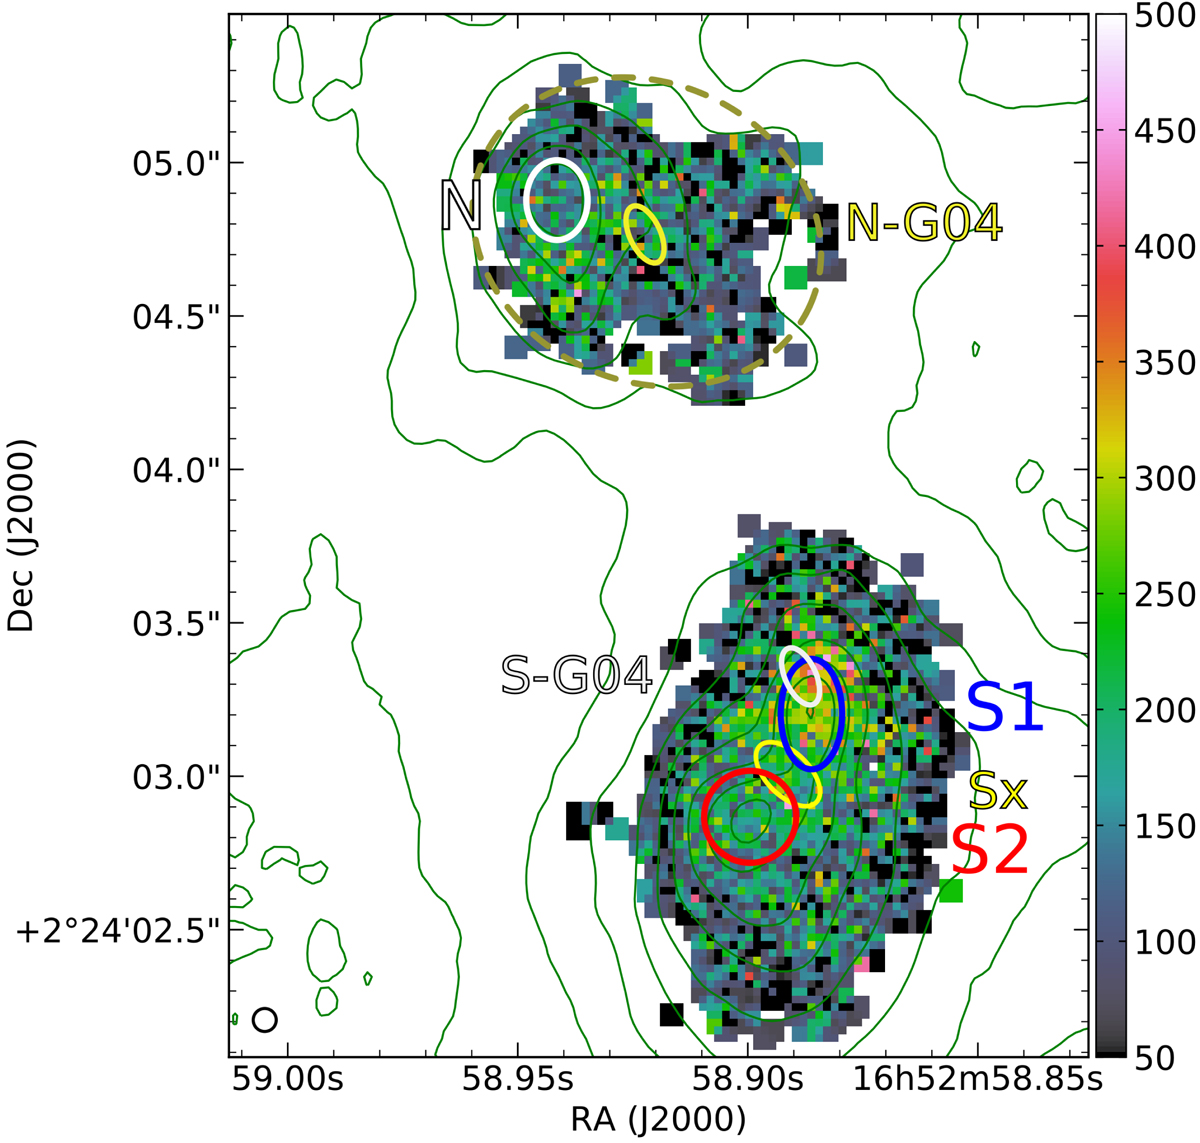
Stellar dispersion map of the northern and southern nuclear bulge regions based on the CaII IR triplet lines in units of km s−1. White regions represent locations where the S/N was not high enough to obtain good fits.
Current usage metrics show cumulative count of Article Views (full-text article views including HTML views, PDF and ePub downloads, according to the available data) and Abstracts Views on Vision4Press platform.
Data correspond to usage on the plateform after 2015. The current usage metrics is available 48-96 hours after online publication and is updated daily on week days.
Initial download of the metrics may take a while.