Fig. 1.
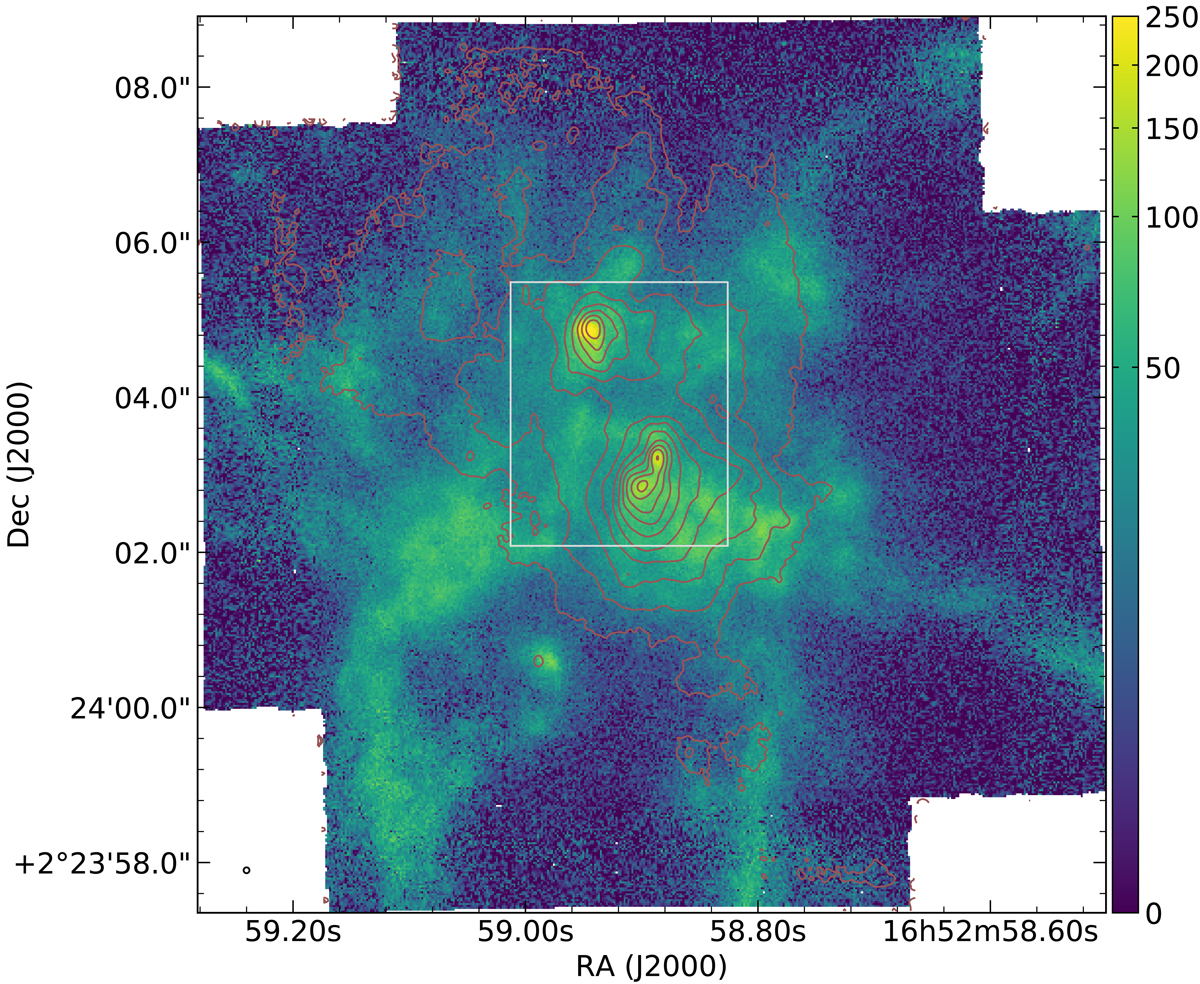
Hα/[NII] image of the gas in NGC 6240. North is to the top and east to the left. Overlaid are I band contour levels (see Fig. 2). The white square indicates the size of the zoomed-in region in Figs. 2, 3, 9, and 10. The estimated spatial resolution at FWHM of 75 mas (35 pc) is plotted in the bottom left corner of each image. The flux is given in units of 10−20 erg cm−2 s−1 pix−1.
Current usage metrics show cumulative count of Article Views (full-text article views including HTML views, PDF and ePub downloads, according to the available data) and Abstracts Views on Vision4Press platform.
Data correspond to usage on the plateform after 2015. The current usage metrics is available 48-96 hours after online publication and is updated daily on week days.
Initial download of the metrics may take a while.