Fig. 4
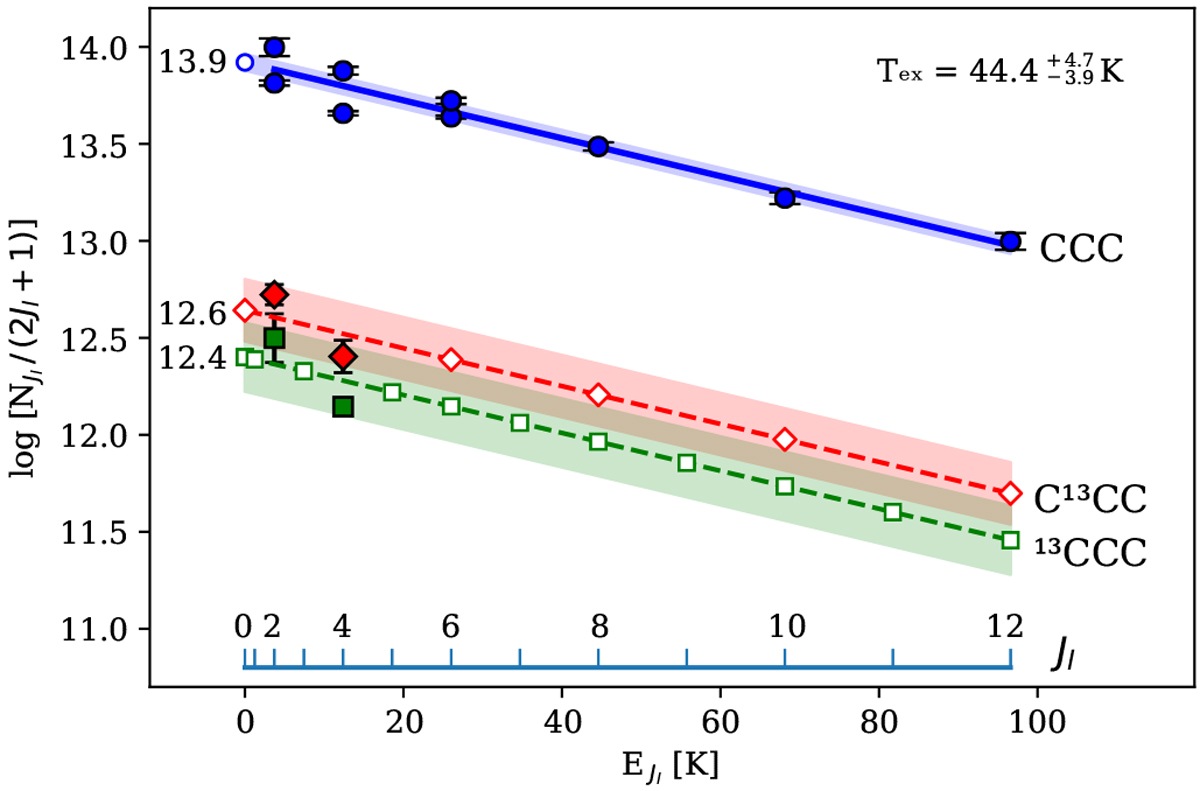
Rotation diagram for C3 lines observed with SOFIA/GREAT, upGREAT and with HIFI/Herschel towards SgrB2(M). The excitation temperature,
Tex = 44.4![]() K, was derived from a linear fit to the state-specific column densities Nl
(Jl = 2, 4,...12) of the main isotopologue, CCC (blue solid line and blue shaded ± 1σ
error range). A straight line with the temperature slope of the main isotopologue was fitted to the data
Jl = 2, 4 of the isotopologues C13CC (red) and 13CCC (green). Filled symbols represent measured values, empty symbols are obtained from the least-squares fit. Note, the centro-symmetric species, CCC and C13CC, only have even-numbered Jl
levels. The numbers to the left are the log (N0) values for Jl = 0 obtained from the fit.
K, was derived from a linear fit to the state-specific column densities Nl
(Jl = 2, 4,...12) of the main isotopologue, CCC (blue solid line and blue shaded ± 1σ
error range). A straight line with the temperature slope of the main isotopologue was fitted to the data
Jl = 2, 4 of the isotopologues C13CC (red) and 13CCC (green). Filled symbols represent measured values, empty symbols are obtained from the least-squares fit. Note, the centro-symmetric species, CCC and C13CC, only have even-numbered Jl
levels. The numbers to the left are the log (N0) values for Jl = 0 obtained from the fit.
Current usage metrics show cumulative count of Article Views (full-text article views including HTML views, PDF and ePub downloads, according to the available data) and Abstracts Views on Vision4Press platform.
Data correspond to usage on the plateform after 2015. The current usage metrics is available 48-96 hours after online publication and is updated daily on week days.
Initial download of the metrics may take a while.