Open Access
Fig. 6
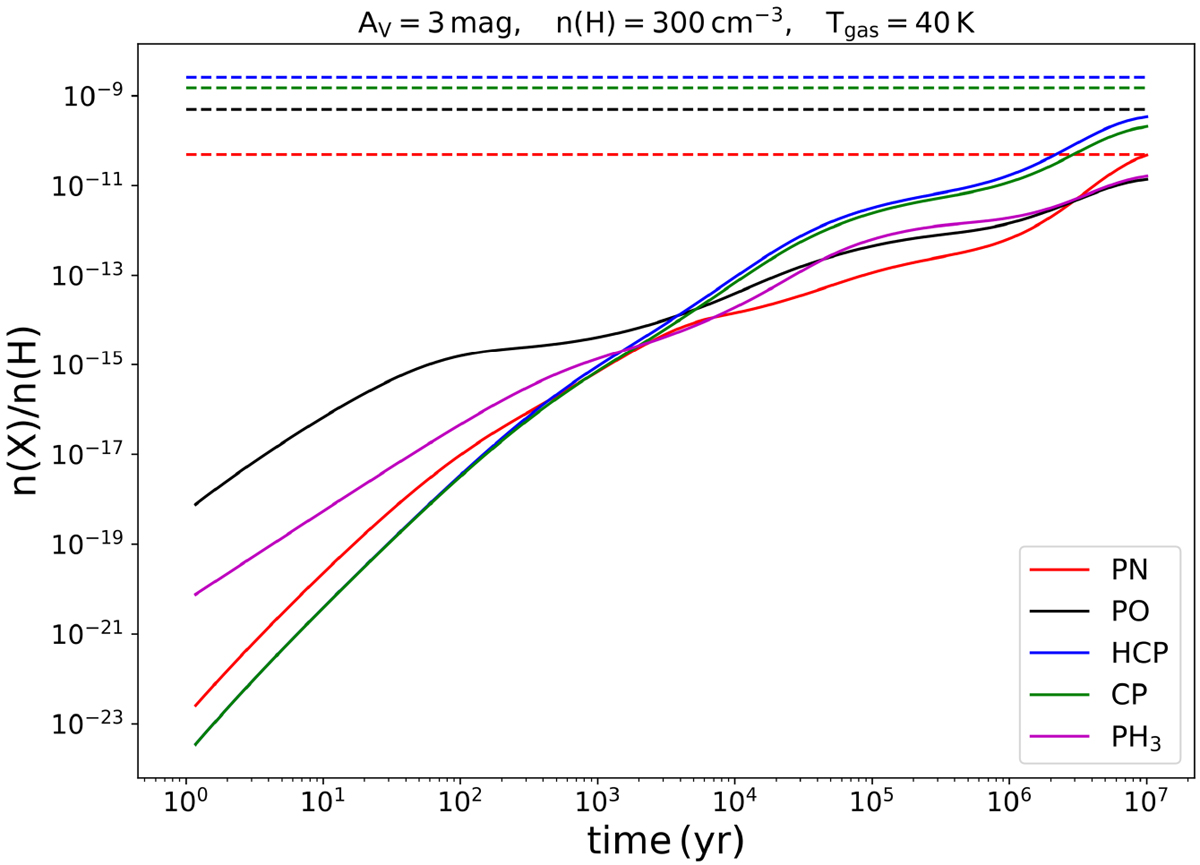
Variation of the predicted abundances of PN, PO, HCP, CP and PH3 over 107 yr in our best-fit model. The dashed lines represent the 3σ upper limits derived from the observations at vLSR = −17 km s−1. In the case of PO we use 5 × 10⁻¹⁰ as an upper limit (see Table 9 and text for explanation).
Current usage metrics show cumulative count of Article Views (full-text article views including HTML views, PDF and ePub downloads, according to the available data) and Abstracts Views on Vision4Press platform.
Data correspond to usage on the plateform after 2015. The current usage metrics is available 48-96 hours after online publication and is updated daily on week days.
Initial download of the metrics may take a while.