Fig. 5
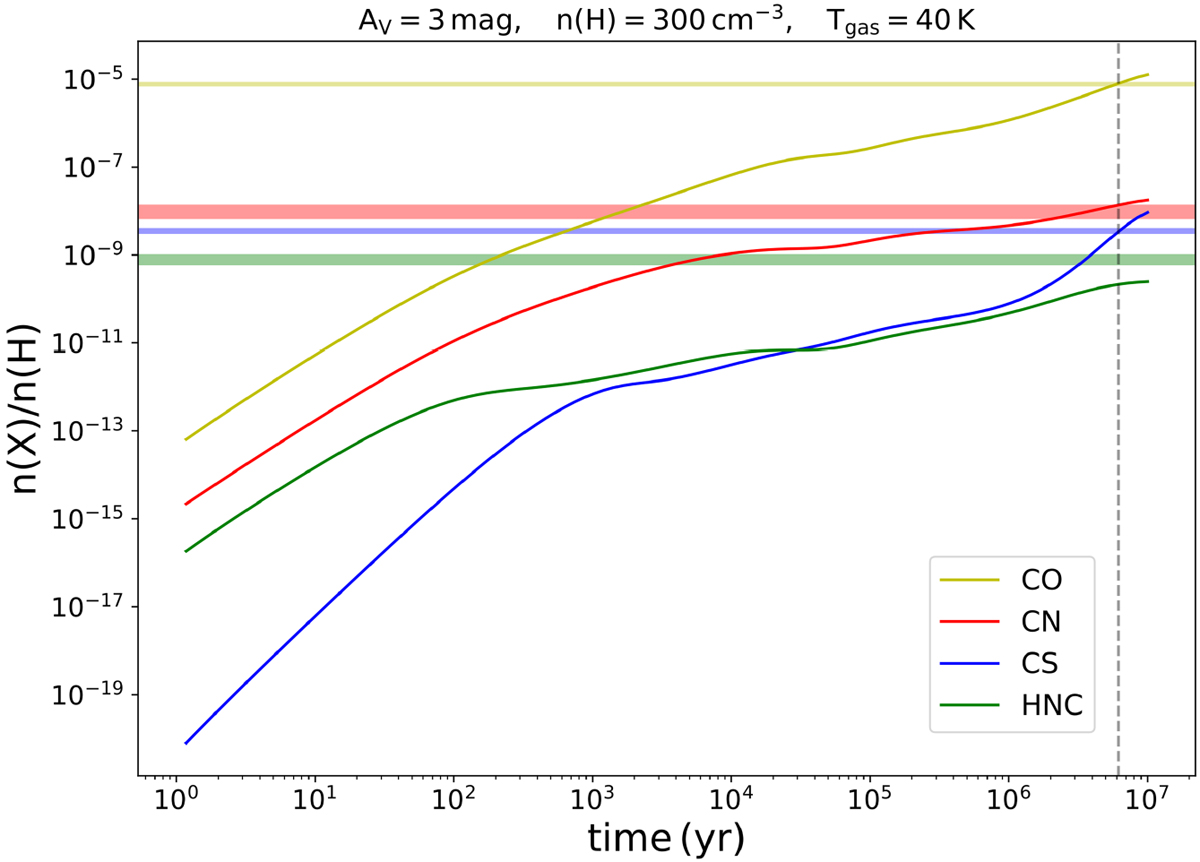
Chemical evolution of the abundances of CO, CN, CS and HNC over 107 yr predicted by our best-fit model with the parameters (n(H), AV, Tgas) = (300 cm−3, 3 mag, 40 K). The colored horizontal bands correspond to the observed abundances towards the cloud with vLSR =−17 km s−1, including the inferred uncertainties. The vertical dashed line indicates the time of best agreement (t = 6.2 × 10⁶ yr) between observations and model results.
Current usage metrics show cumulative count of Article Views (full-text article views including HTML views, PDF and ePub downloads, according to the available data) and Abstracts Views on Vision4Press platform.
Data correspond to usage on the plateform after 2015. The current usage metrics is available 48-96 hours after online publication and is updated daily on week days.
Initial download of the metrics may take a while.