Fig. A.1
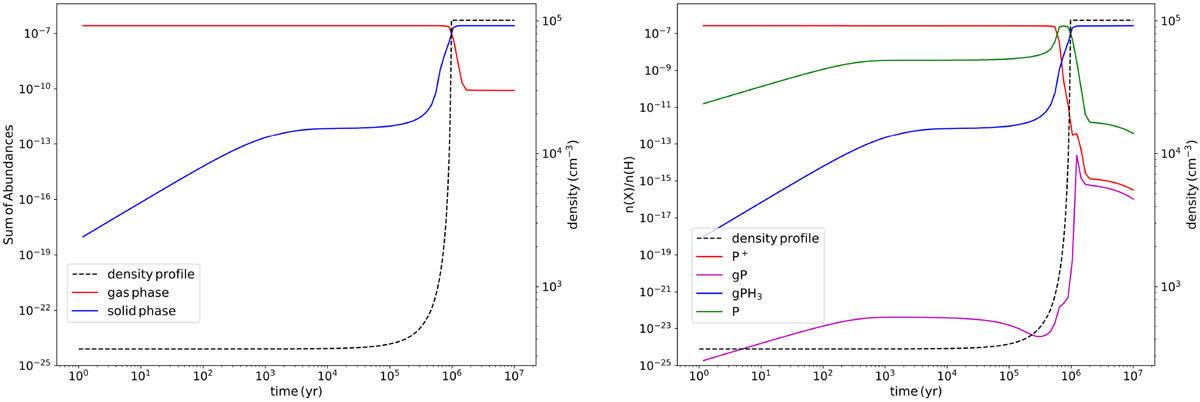
Results of our dynamical model that simulates the transition from a diffuse to a dense cloud. Left panel: sum of abundances of all P-bearing species in the gas phase (red line) and the solid phase (blue line) as a function of time. Right panel: chemical evolution of the main carriers of phosphorus in the gas and solid phase: P+, P, gP and gPH3. In both figures the density profile of the free-fall collapse is depicted as a black dashed line.
Current usage metrics show cumulative count of Article Views (full-text article views including HTML views, PDF and ePub downloads, according to the available data) and Abstracts Views on Vision4Press platform.
Data correspond to usage on the plateform after 2015. The current usage metrics is available 48-96 hours after online publication and is updated daily on week days.
Initial download of the metrics may take a while.