Fig. 1
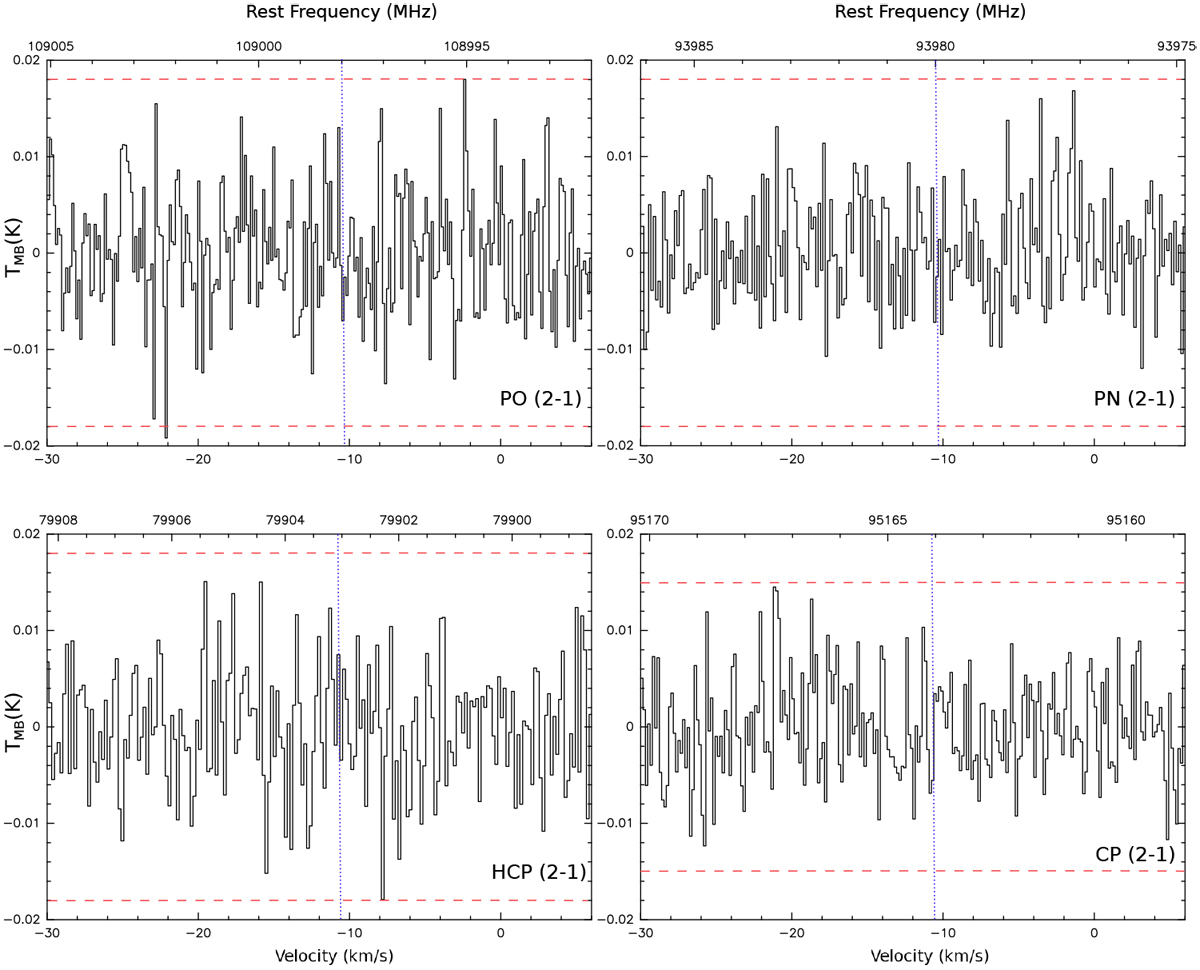
Spectra of the nondetected (2–1) transitions of PO, PN, HCP, and CP. The upper x-axis shows the rest frequency (in MHz) and the lower one is a velocity axis (in km s−1). The red dashed line indicates the 3σ level and the blue dashed line shows the transition frequency of the corresponding molecule. In the case of PO, we show as an example one of the observed transitions at 108.998 GHz.
Current usage metrics show cumulative count of Article Views (full-text article views including HTML views, PDF and ePub downloads, according to the available data) and Abstracts Views on Vision4Press platform.
Data correspond to usage on the plateform after 2015. The current usage metrics is available 48-96 hours after online publication and is updated daily on week days.
Initial download of the metrics may take a while.