Fig. 8
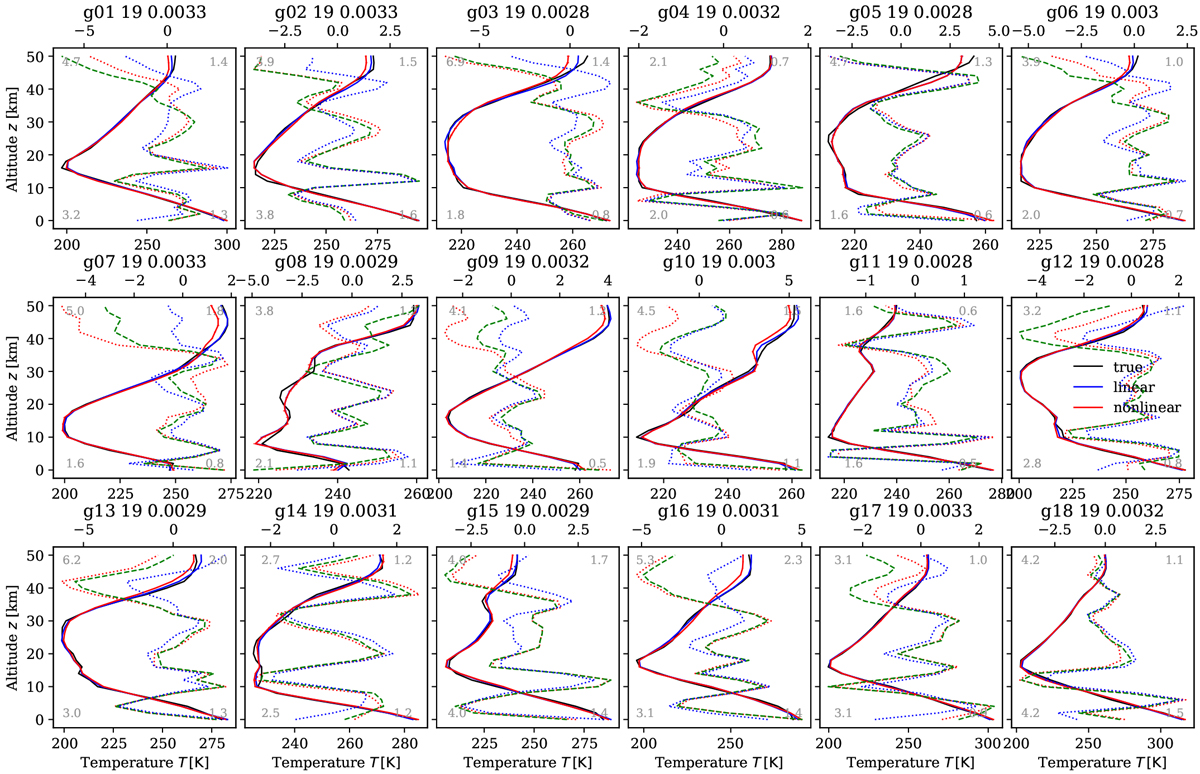
Microwave temperature least squares fits for the first 18 Garand atmospheres: 1.5– 2.1 cm−1 (≈ 60 GHz or 5000 μm), S∕N = 100 and Gauss SRF with HWHM Γ = 0.001 cm−1 (R ≈ 2000). Black: true profile; blue: linear least squares reconstruction; red: nonlinear least squares with initial guess damped mean profile (Eq. (10)). Temperature differences ΔT = Tfit − Ttrue are shown as dotted lines with axis at top. Dashed green: fit with initial guess straight line (Eq. (11)). The title gives the atmosphere’s “name”, the number of iterations, and the squared norm of the radiance residuum. Numbers inside the plots indicate the maximum and mean temperature deviations (top) and corresponding UTLS deviations (bottom).
Current usage metrics show cumulative count of Article Views (full-text article views including HTML views, PDF and ePub downloads, according to the available data) and Abstracts Views on Vision4Press platform.
Data correspond to usage on the plateform after 2015. The current usage metrics is available 48-96 hours after online publication and is updated daily on week days.
Initial download of the metrics may take a while.